Join Our Telegram channel to stay up to date on breaking news coverage
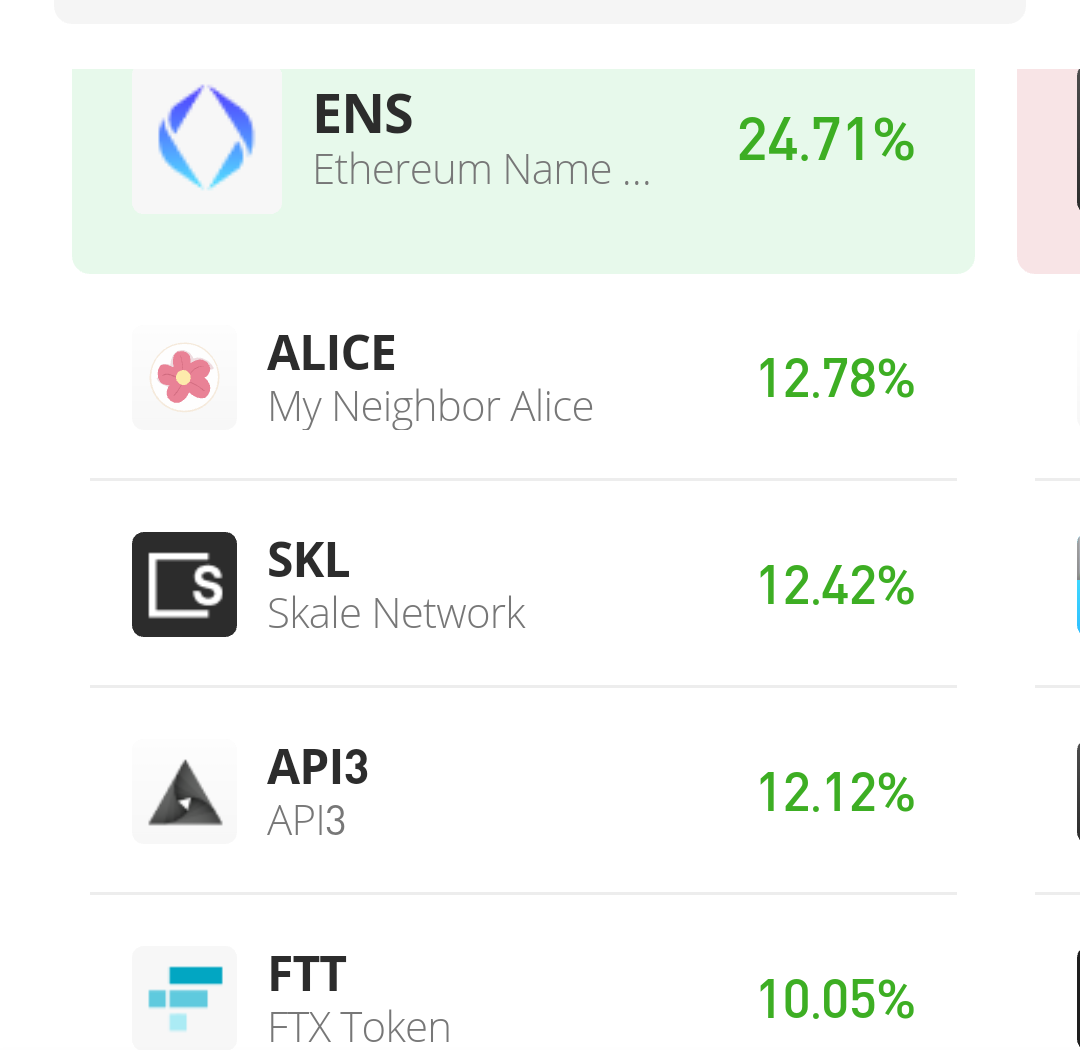
Ethereum Name Service Seems to be one of the best performing cryptos today. This crypto has moved approximately 25% of its value in just a day. And, by this performance, ENS should be the best performing crypto in the market. Currently, this crypto now trades at $ 15.38, and it looks like this crypto may price even higher.
ENS price now: $15.38
ENS Market Cap: 314.2 million
ENS Total Supply: 100 million
ENS Rank: 101
Important Levels:
Resistance: $12.40, $12.60, $15.38
Support: $12.40, $12.10, $11.80

ENS/USD Value Prediction: Ethereum Name Service Bulls Apppears Exhausted But not Ready to Downtrend
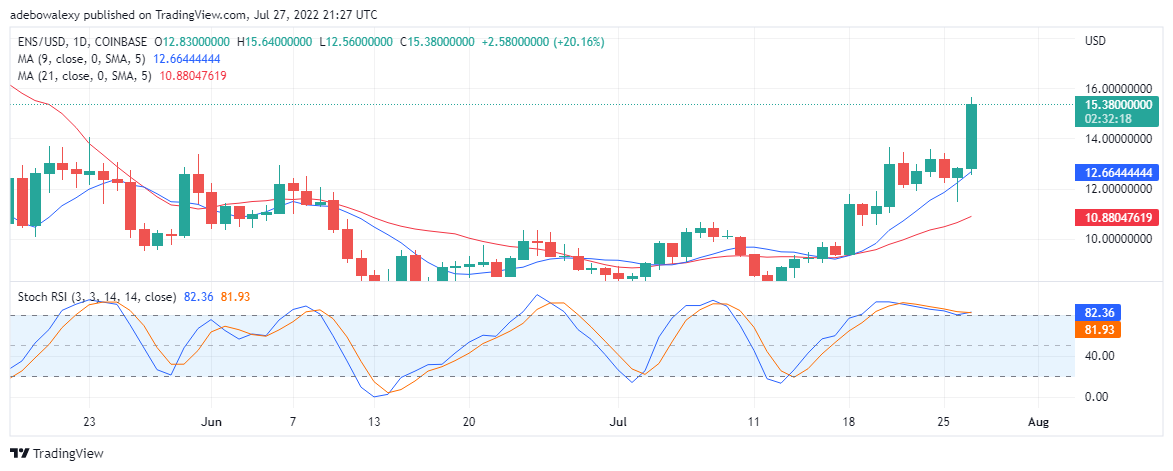
Considering the daily chart for ENS/USD, one can notice how increasing volatility has propelled the crypto value higher. Furthermore, the uptrend seems to be at its end, yet trading indicators are yet undecided about a trend reversal. The MA (Moving Average) lines stay under the candlestick, however, it appears as if the faster MA line is seeking to cross above some candlestick. And, if this eventually happens value movement may range or downtrend.
Also, the Stochastic Relative Strength Indicator, affirms that the uptrend may have reached its end. Nevertheless, the closeness between the lines indicates that trend is trying not to reverse. Additionally, if we look at the terminal end of these lines, one can see that these lines appear to have made a sideways cross. This may result in the price going upward still since the 100% on the indicator is yet to be reached. Eventually, the price of ENS could arrive at $16 or $17 price levels.
ENS/USD Value Prediction: A Downtrend May Be on the Rise in Ethereum Name Service Market
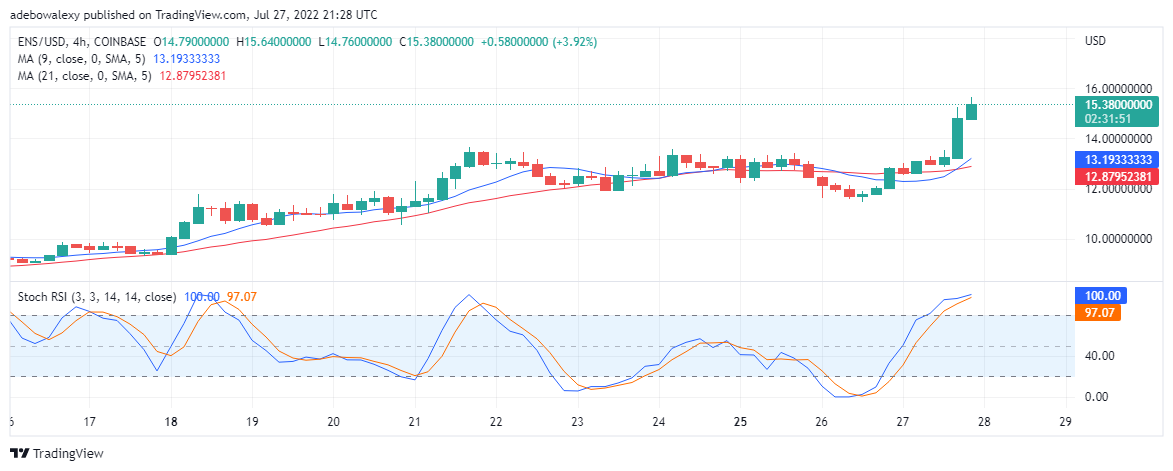
Even though the MA lines are still under price candlesticks, the ENS/USD four-hour chart reveals that a trend reversal may be setting in. Here, we can see that the MA lines are already crossed, and are moving apart. Also, the distance between these lines gets wider as they progress, soon these lines may trap candlesticks.
Eventually, occurs, price motion may break downwards the resistance formed by the slower MA and the price may downtrend. Also, the SRSI confirms the possibility of this occurrence, as the lines of this indicator are about to cross in the oversold region.
Join Our Telegram channel to stay up to date on breaking news coverage


