Join Our Telegram channel to stay up to date on breaking news coverage
BCH Price Prediction – January 3
In the recent past, a price resistance hindered the upsurge in the BCH/USD trade transactions. But, the crypto’s value has now risen visibly above the critical price region.
Bbbbb BCH/USD Market
Key Levels:
Resistance levels: $450, $500, $550
Support levels: $325, $275, $225
BCHUSD – Daily Chart
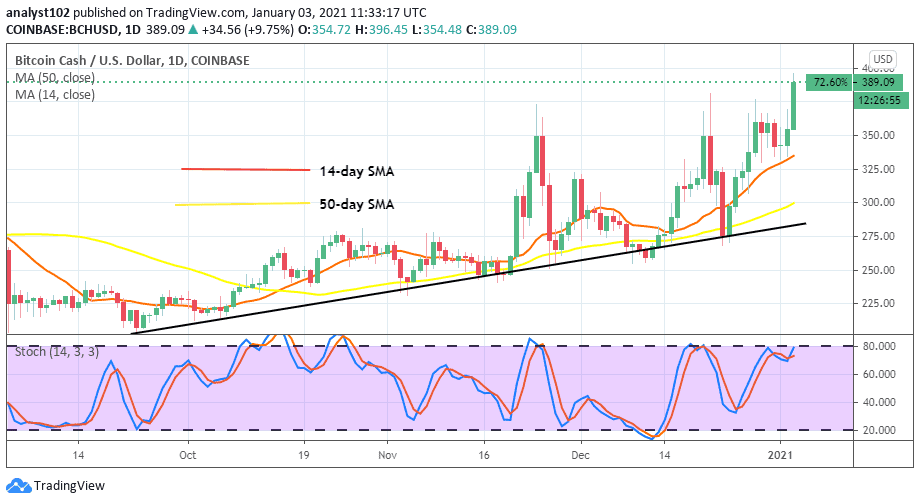
There has been no much different outlook on what the trading chart showcases over time until now. The BCH/USD bulls are still so much in control of the crypto-trade. Thereby, no chance has let out for bears to muster up a power of regaining a position as of now. The northward pressure may have to continue unchecked while the price doesn’t revisit the recently-past resistance point around $360 for a downward break. The two SMA indicators point to the north direction to uphold a bullish sentiment of the market. The Stochastic Oscillators are in consolidation moving manner around range 80 to attest to the bulls’ dominance position in the BCH/USD trade economy.
Where is BCH/USD Price Going Next?
The market value of around $350 currently would a mere support line to the price upswing forces. The least expectation at that level is that the crypto-value moves should only make a testing form devoid of a further downward-movement to sustain the present bullish trend. That assumption plays out accordingly, a continuation of seeing more upward price moves of the market.
However, traders considering long on this trade now may be risking position at late entry. That may lead to a bulls’ trap. Despite that assumption, the BCH/USD bulls still possess better chances to push higher at the advantage of bears. Therefore, more high values are to achieve more than the present high market trading point of around $390.
BCHBTC Price Analysis
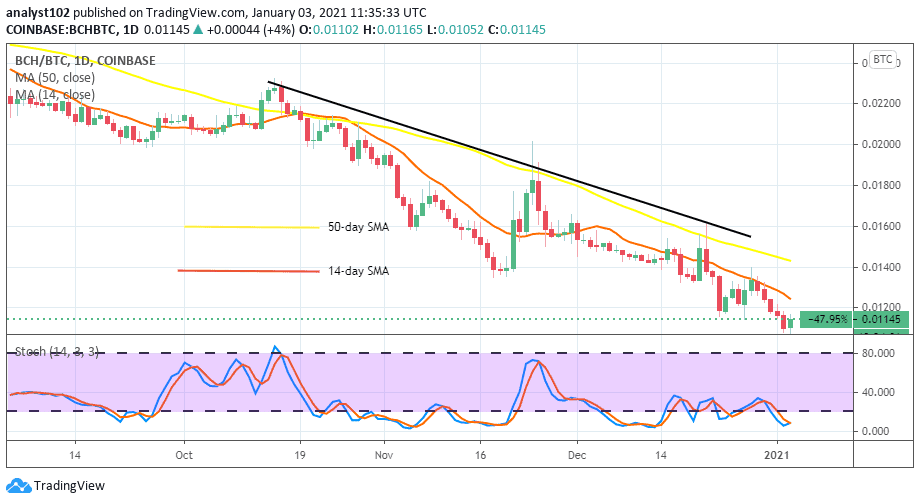
Comparing BCH with BTC moves, it is still clear that the BTC’s is still playing a dominant role over the BCH trade instruments. As of the time of writing, Bitcoin Cash is traded around a lowlier price line at B0.012 under the 14-day SMA sell signal line. Meanwhile, the two SMA indicators still point southward over the market trading value. The Stochastic Oscillators suggest that the current falling over has reached a level of oversold. That calls for a cautious further sell-entry of the trading instrument.
Join Our Telegram channel to stay up to date on breaking news coverage


