Join Our Telegram channel to stay up to date on breaking news coverage
XRP Price Analysis – December 12
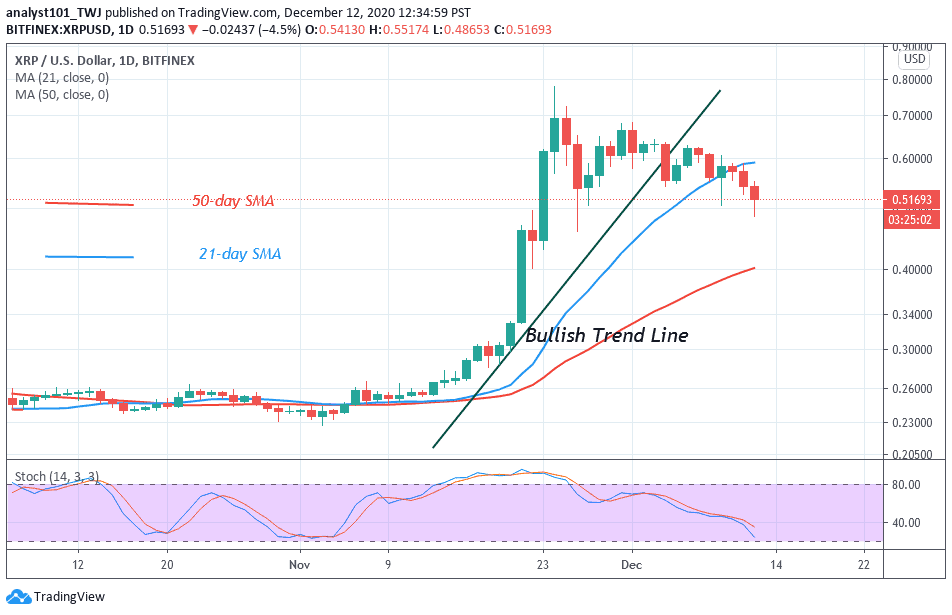
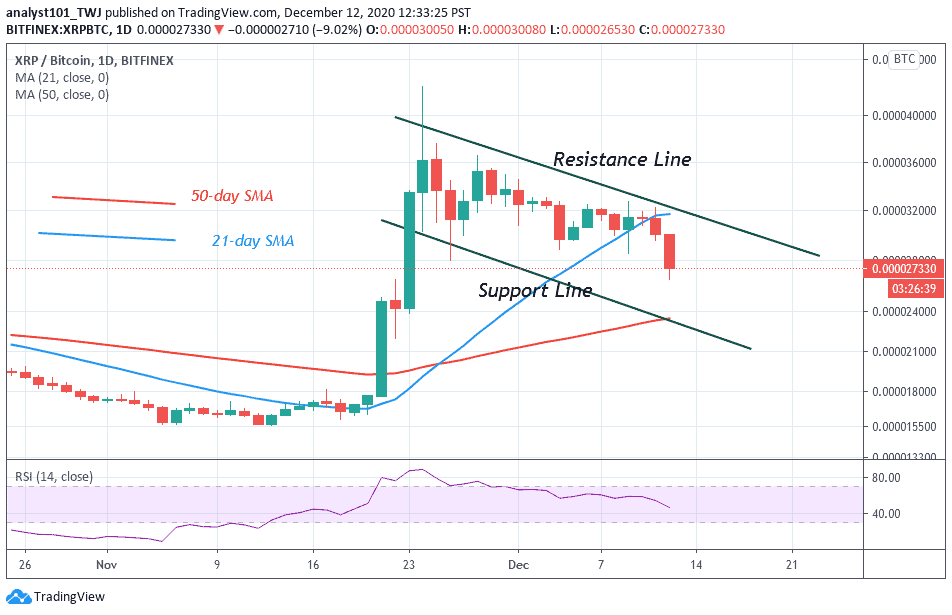
XRP/USD has fallen from a high of $0.78 to $0.50 low. XRP price is making a series of lower highs and lower lows. The crypto has the tendency of a further downward move as it broke the 21-day SMA. The XRP/BTC is in a downward move. The crypto has already fallen to Ƀ0.000027110.
XRP/USD Market
Key Levels:
Resistance Levels: $0.24, $0.26, $0.28
Support Levels: $0.22, $0.20, $0.18

Today, XRP/USD has continued a downward move as the coin reached a low of $0.50. Before now, buyers have pushed the price twice on the upside. In the first uptrend, the altcoin rallied to $0.75 high but plunged to $0.45 low. In the second uptrend, the coin rallied to $0.67 but was resisted. The crypto resumed a downward move. The coin is falling to revisit the previous low at $0.45. Ripple is likely to find support and resume an upward move. However, the downtrend will continue if the price breaks the support at $0.45. Meanwhile, the selling pressure is ongoing.
Ripple (XRP) Indicator Analysis
The price has broken the trend line signaling the end of the uptrend. The price also broke the 21-day SMA and it is approaching the 50-day SMA. A break below the SMAs suggests that the coin will continue to fall. XRP is below the 40% range of the daily stochastic. It indicates that the coin is in a bearish momentum

In the case of XRP/BTC, the crypto is in a downtrend. The crypto faced rejection at Ƀ0.000040000 and resumed a downward move. The coin has fallen to Ƀ0.000026800 at the time of writing. The price is also approaching the support of the descending channel. The selling pressure will persist if the support line is broken.
Join Our Telegram channel to stay up to date on breaking news coverage

