Join Our Telegram channel to stay up to date on breaking news coverage
LTC Price Prediction – October 31
LTC/USD may likely set a bullish run if the market can climb back above $58.
LTC/USD Market
Key Levels:
Resistance levels: $60, $62, $64
Support levels: $50, $48, $46
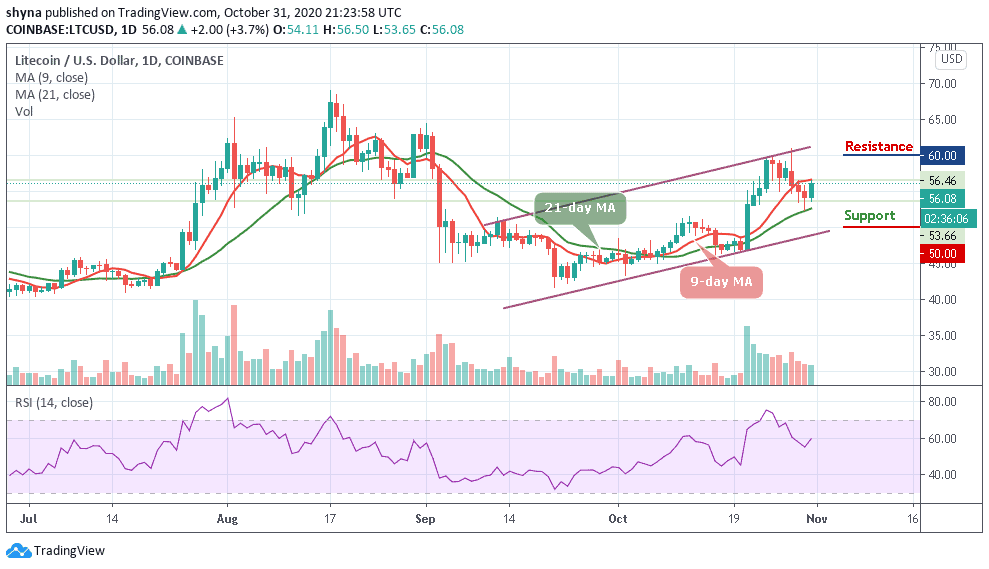
At the moment, LTC/USD is actually running a little retracement move towards $57 with a price growth of 3.7%. Apart from today’s gain, Litecoin (LTC) is still maintaining a sideways movement within the channel. Traders may expect the price to continue to rise as soon as the bulls put more pressure on the market.
What to Expect from Litecoin (LTC)
If LTC/USD breaks below the 21-day moving average this time, the market price may slide back to $52 support. But if the price keeps respecting the upward movement, traders can then expect a bullish continuation towards the upper boundary of the channel. Meanwhile, as the technical indicator RSI (14) is about to cross above the 60-level, the possible resistance levels could be found at $50, $48, and $46 in the long-term.
Meanwhile, if the coin keeps the bullish movement for the next couple of days, traders may witness more of it to reach the higher levels. Inversely, a bearish extension could roll the coin back to the long-term support at $50, $48, and $46 levels.
When compares with BTC, the Litecoin (LTC) is seen following the sideways movement but trading below the 9-day and 21-day moving averages. Should in case a trend reversed, there is a need for an increasing volume and resistance to cause an upsurge in the market. Now, the coin is trading around the 4044 SAT. We can expect close support at the 3700 SAT and below.
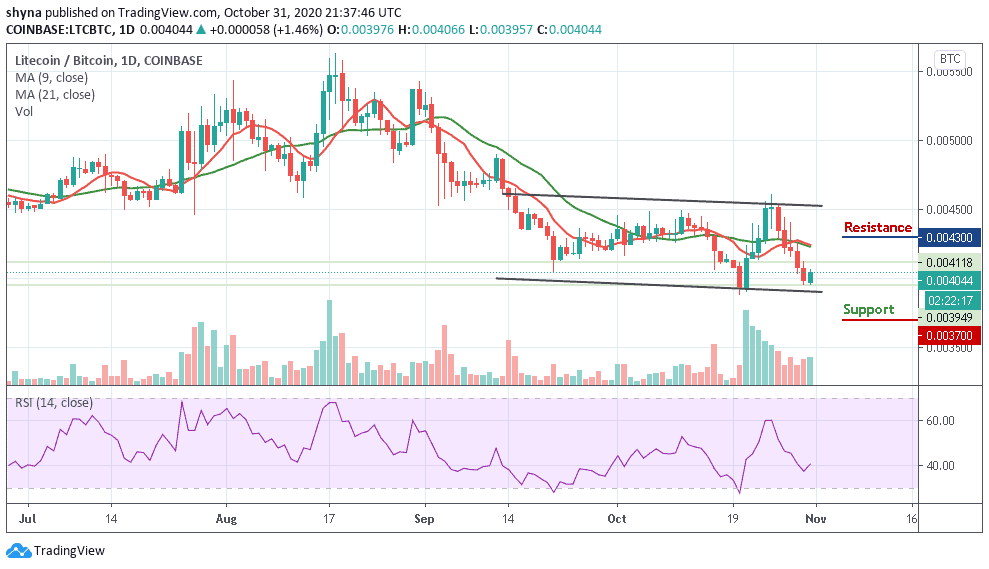
However, if a bullish move occurs and validates a break significantly above the moving averages to hit the nearest resistance at 4200 SAT; we can then confirm a bull-run for the pair. More so, the closest resistance lies at 4300 SAT and above as the RSI (14) moves above 40-level.
Join Our Telegram channel to stay up to date on breaking news coverage