Join Our Telegram channel to stay up to date on breaking news coverage
Bitcoin (BTC) Price Prediction – July 23
The Bitcoin’s technical picture implies that the price may retreat to $9,400 before resuming back to the upside.
BTC/USD Long-term Trend: Ranging (Daily Chart)
Key levels:
Resistance Levels: $10,000, $10,200, $10,400
Support Levels: $9,200, $9,000, $8,800

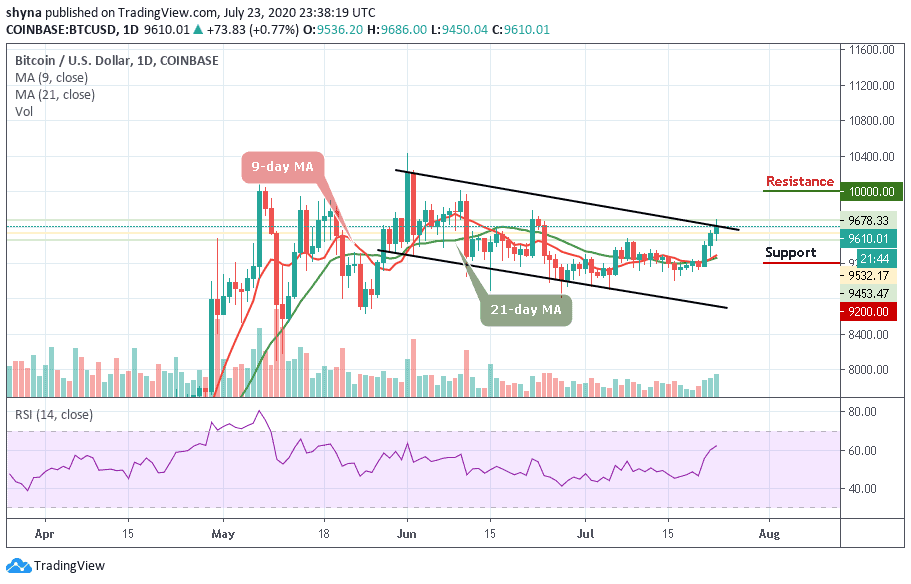
At the time of writing, BTC/USD is changing hands at $9,610 as the bulls struggle to keep the price above $9,600. If this barrier gives way, the sell-off may be extended towards $9,400 with critical support created by 9-day and 21-day moving averages at $9,250. The short-term trend remains bullish as long as the Bitcoin price remains above this level. Once it is broken, the support levels of $9,200, $9,000, and $8,800 may come into view.
Considering that the daily technical indicator RSI (14) has reversed to the upside, BTC/USD has the potential to return to the area above $9,700 and test the new resistance on approach to $9,700. More so, where the Bitcoin trends will go next now depends on its reaction to $9,800. Once it is out of the way, the upside is likely to gain traction with the next focus on $10,000, $10,200, and $10,400 resistance levels.
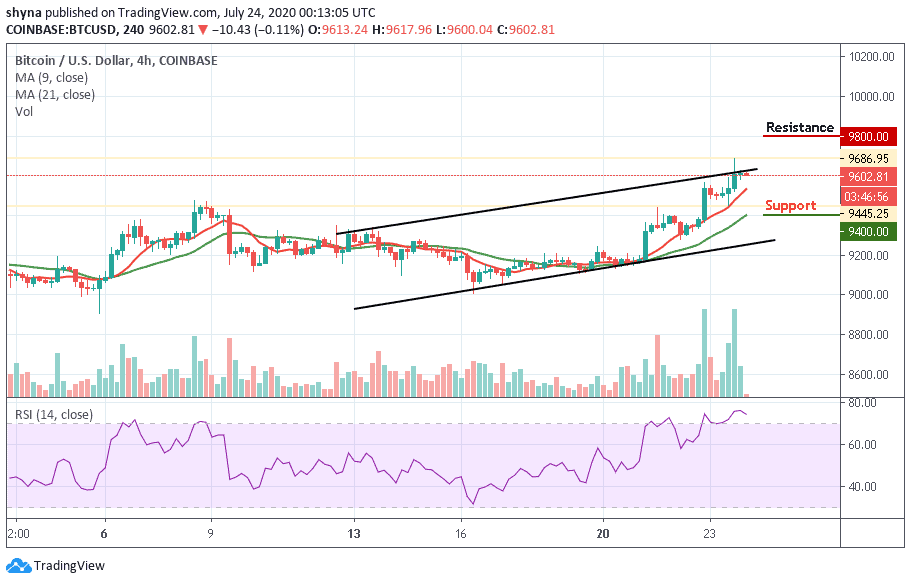
According to the 4-hour chart, the Bitcoin price surged upwards of over $200 in today’s trading session, catapulting its price from $9,445 to reach around $9,686. After the sudden rise, the coin started dropping in price to where it’s trading currently at $9,602. Should the price continue to drop further, it could reach the nearest supports at $6,400, $6,200, and $6,000 respectively.

Moreover, if the bulls could put a little effort to push the price above the upper boundary of the channel, the Bitcoin price may likely hit the crucial resistance at $9,700 before heading to the potential resistance levels of $9,800, $10,000, and $10,200. Meanwhile, the RSI (14) is extremely within the overbought zone, which shows more bullish momentum.
Join Our Telegram channel to stay up to date on breaking news coverage

