Join Our Telegram channel to stay up to date on breaking news coverage
Bitcoin Price Prediction (BTC) – June 27
The Bitcoin price is down from $9,725 to $8,968 in the last 5 days. No quick recovery seems possible for the coin.
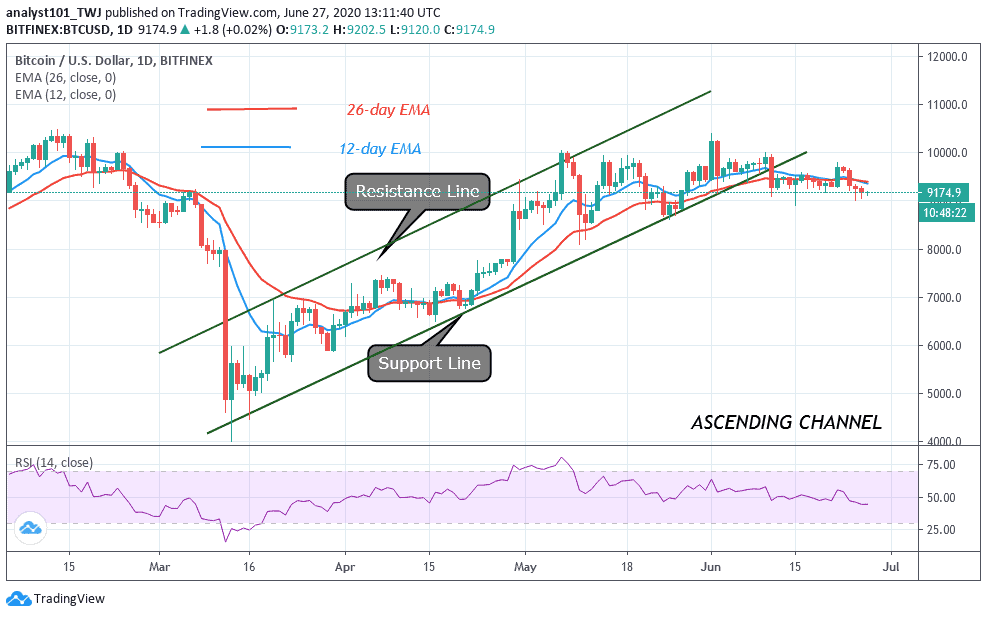
BTC/USD Long-term Trend: Bearish (Daily Chart)
Key levels:
Resistance Levels: $10,000, $10,200 $10,400
Support Levels: $8,300, $8,100, $7,900
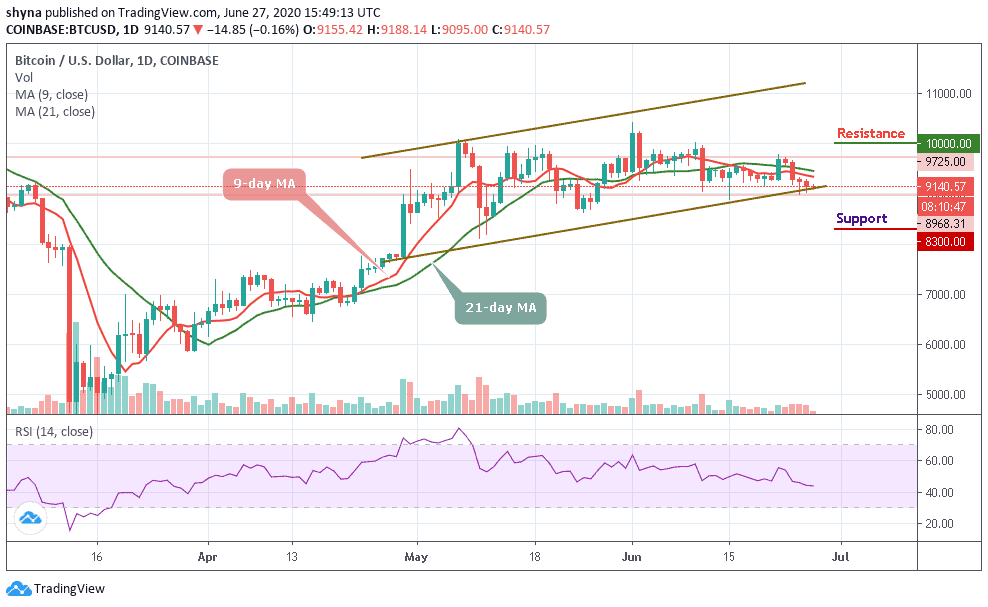
BTC/USD is seen facing a setback for now; this is not a permanent one. The coin is likely to have a bullish run in the short-term but a price rally may help the coin to touch its weekly high. Currently, Bitcoin is trading around $9,140 level after a free fall from $9,725 a few days back. The coin has shown tremendous volatility over the past 5 days.
As of now, Bitcoin is aiming to fall again, but the key support is becoming a threat to the bears. There are quite a number of technical levels clustered above the current price which means that the coin may be vulnerable to further losses at least as long as it goes below critical $9,000. BTC/USD pair may drop to $8,300, $8,100, and $7,900 supports if the $8,800 support fails to hold.
In the opposite direction, if critical support can continue to provide support for the market, definitely we can expect the Bitcoin price to come back to a resistance level of $9,800 before the market experience a rise far above the 9-day and 21-day moving averages to reach the potential resistance levels of $10,000, $10,200, and $10,400 respectively. The technical indicator RSI (14) is falling, a further drop may cause the Bitcoin price to fall more but a buying pressure may visit the market soon.
BTC/USD Medium-term Trend: Bearish (4H Chart)
According to the 4-hour chart, the bears are dominating the market and the price is dropping below the 9-day and 21-day moving averages heading towards the south. However, if the price breaks below the trend line of the descending channel and continues to fall, the support levels of $8,800 and below may come into play.
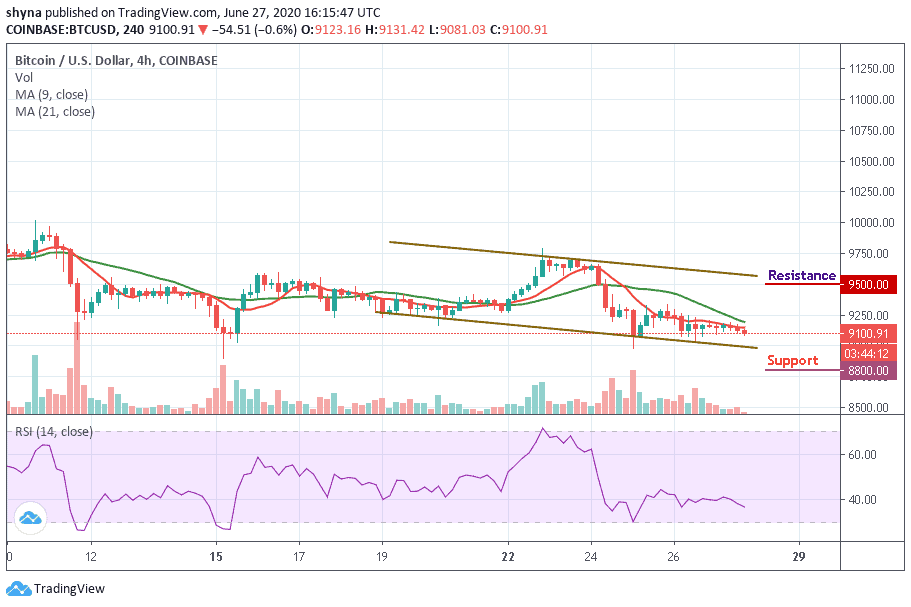
Meanwhile, as the technical RSI (14) moves downward, on its way back to the top, the buyers would have gathered enough momentum to fuel the market and they may push the price above the moving average where it could hit the targeted resistance levels of $9,500 and above.
Join Our Telegram channel to stay up to date on breaking news coverage