Join Our Telegram channel to stay up to date on breaking news coverage
Bitcoin (BTC) Price Prediction – June 27, 2020
BTC/USD was previously hovering above $9,200 but it is now trading below $9,200 high. The price action is showing a series of small body candlesticks as price consolidates. These indecisive candlesticks indicate that buyers and sellers are undecided about the direction of the market.
Key Levels:
Resistance Levels: $10,000, $11, 000, $12,000
Support Levels: $7,000, $6,000, $5,000

Since June 26, Bitcoin has remained in the lower region of $9,000. BTC is showing signs of weakness as bulls fail to push prices above $9,300 to resume the upside range trading. However, if the bulls fail to hold the $9,000- $9,200 support, it will signal the resumption of the downtrend. BTC will face deeper correction if the $9,000 support cracks. The king coin initial support will be at $8,800 low. As selling pressure persists the market will fall to either $8,500 or $8,200.
The bearish momentum can extend to $8,130 low. The Relative Strength Index period 14 is at level 44. Bitcoin is in the downtrend zone and below the centerline 50. The price bars are below the 12-day EMA and the 26-day EMA which makes the coin vulnerable to fall. The price action has indicated a bearish signal as the market continues its downward move.
BTC/USD Medium-term Trend: Bullish (4-Hour Chart)
On the 4 hour chart, the Fibonacci tool indicates that Bitcoin will rise and retest the $9,950 resistance zone. The red correction candle body tested the 0.786 Fibonacci retracement level. This indicates that the market will rise to $9,900.
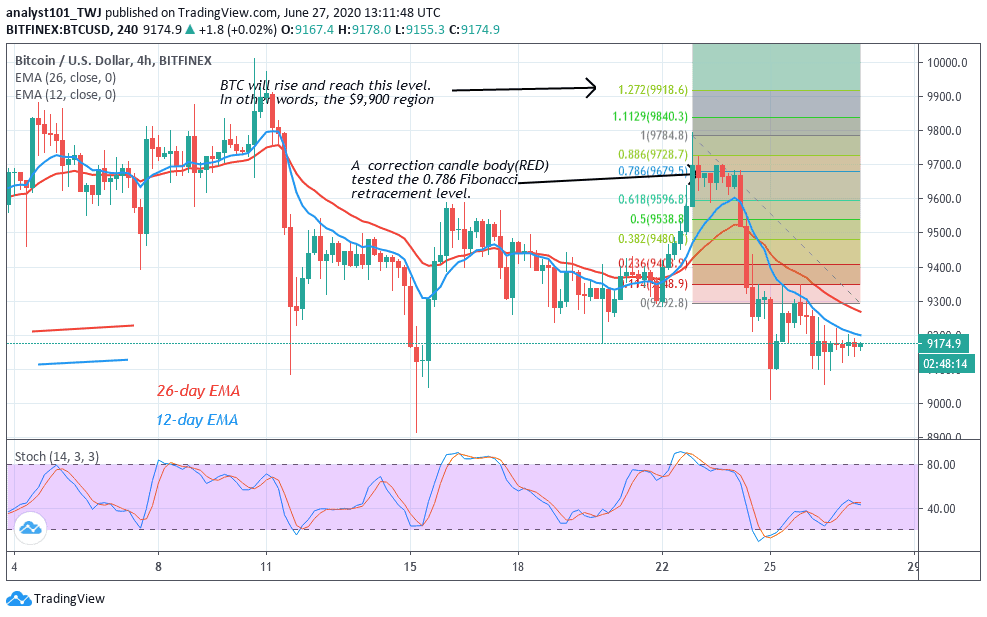
Therefore, BTC is likely to move up to $9,300 to resume the upside range trading. Presently, the king coin is consolidating above $9,100. After consolidation, the price is likely to rebound above the current support to resume the upside range trading. In the upside range trading, price fluctuates between $9,300 and $9,800 to retest the $10,000 overhead resistance. Nonetheless, if BTC rises to $9,900, it is likely to reverse, though the reversal will not be immediate. The price will fall and return to 0.786 Fibonacci retracement level. In other words, it will fall to $9,700 low and resume consolidation. The king coin is above 40% range of the daily stochastic. Presently, it is in a bullish momentum.
Join Our Telegram channel to stay up to date on breaking news coverage