Join Our Telegram channel to stay up to date on breaking news coverage
XRP Price Analysis – June 27
XRP/USD has continued its downward move as bears broke the $0.18 low but pulled back to trade at $0.181 at the time of writing. The selling pressure has persisted because of Ripple lack of buyers at higher levels. In the XRP/BTC, the crypto is on a downward move as the coin reached the low of Ƀ0.00001993.
XRP/USD Market
Key Levels:
Resistance Levels: $0.24, $0.26, $0.28
Support Levels: $0.22, $0.20, $0.18
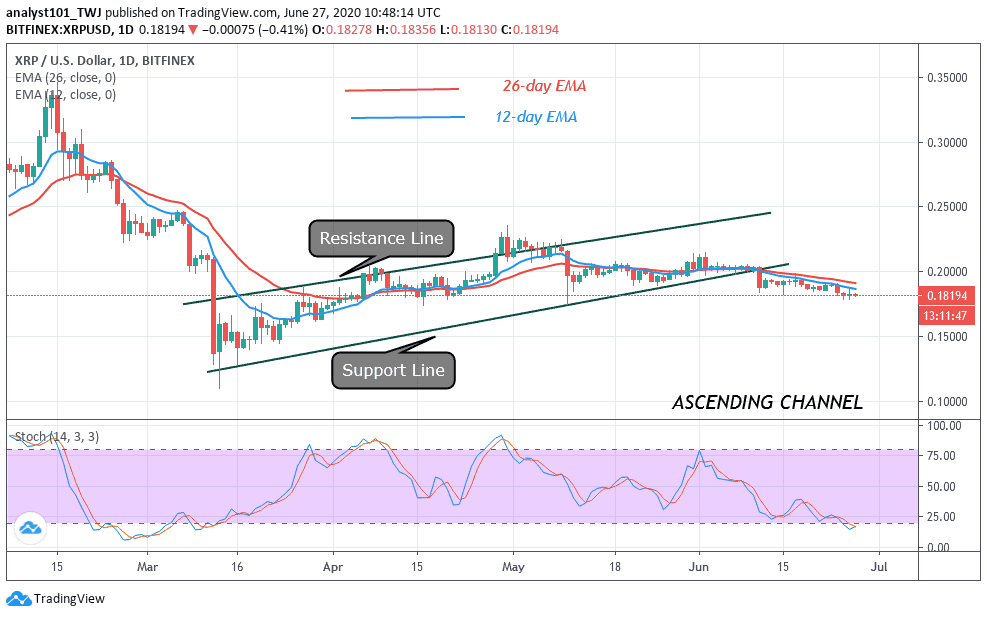
On June 26, Ripple dropped again below $0.18 low, but the bulls pulled back price. The price corrected upward and retested the $0.185 resistance. The coin resumed a downward move after retesting the $0.185 resistance. Previously, XRP has been trading between $0.185 and $0.195 for two weeks. About 48 hours ago, the bears broke the $0.185 support to further depreciate the coin. Presently, Ripple is trapped between $0.18 and $0.185 price levels but the coin is trading at $0.181 low.
On the upside, if price rebounds above the current support, it is likely to break the resistance at $0.185 but may face stiff resistance at $0.19. On the other hand, if the bears break the $0.18 support, XRP will further depreciate to $0.16 low. Meanwhile, Ripple has fallen below 20% range of the daily stochastic. It indicates that the market is in the oversold region. Perhaps, buyers are likely to emerge to push prices upward. If buyers emerge the $0.18 support is likely to hold as price moves up.
XRP/BTC is also in a downward move. A Fibonacci tool is used to determine the extent of the downward move. A correction candle body tested 0.50 Fibonacci retracement level.
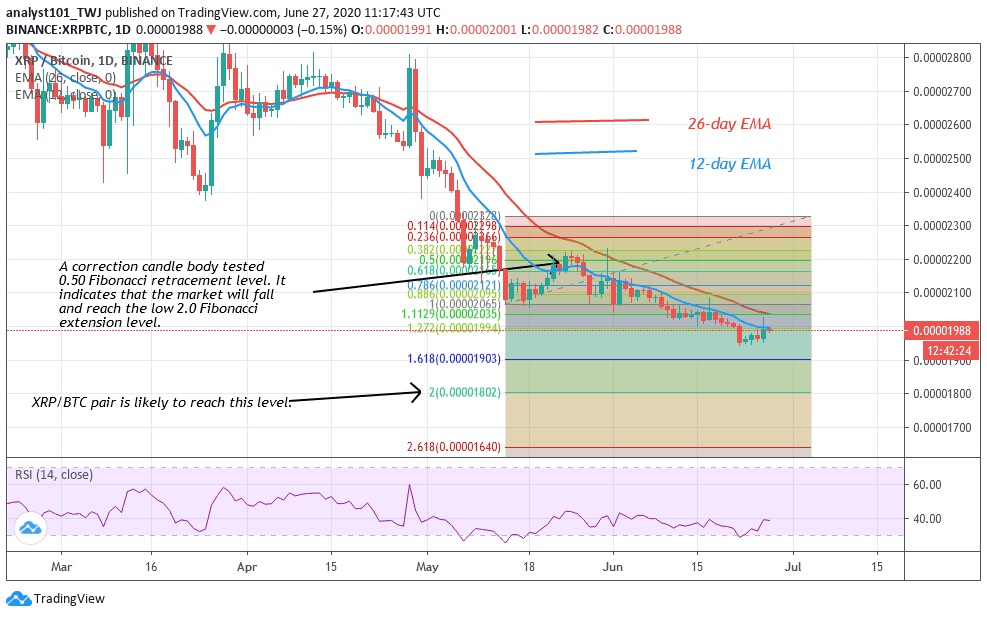
It indicates that the market will fall and reach a low 2.0 Fibonacci extension level. In other words, the coin will fall and reach a low of Ƀ0.00001800. XRP/BTC is at level 39 of the Relative Strength Index. It indicates that the price is in the downtrend zone and it is below the centerline 50. The pair is approaching the oversold region where buyers are likely to emerge.
Join Our Telegram channel to stay up to date on breaking news coverage