Join Our Telegram channel to stay up to date on breaking news coverage
Bitcoin (BTC) Price Prediction – June 25, 2020
Yesterday, BTC/USD pair encountered a breakdown after it was resisted at $9,800 high and failure of the bulls to sustain price above $9,600 support. Presently, BTC is trading at $9,291 at the time of writing. However, if the current support cracks the downtrend will resume.
Key Levels:
Resistance Levels: $10,000, $11, 000, $12,000
Support Levels: $7,000, $6,000, $5,000
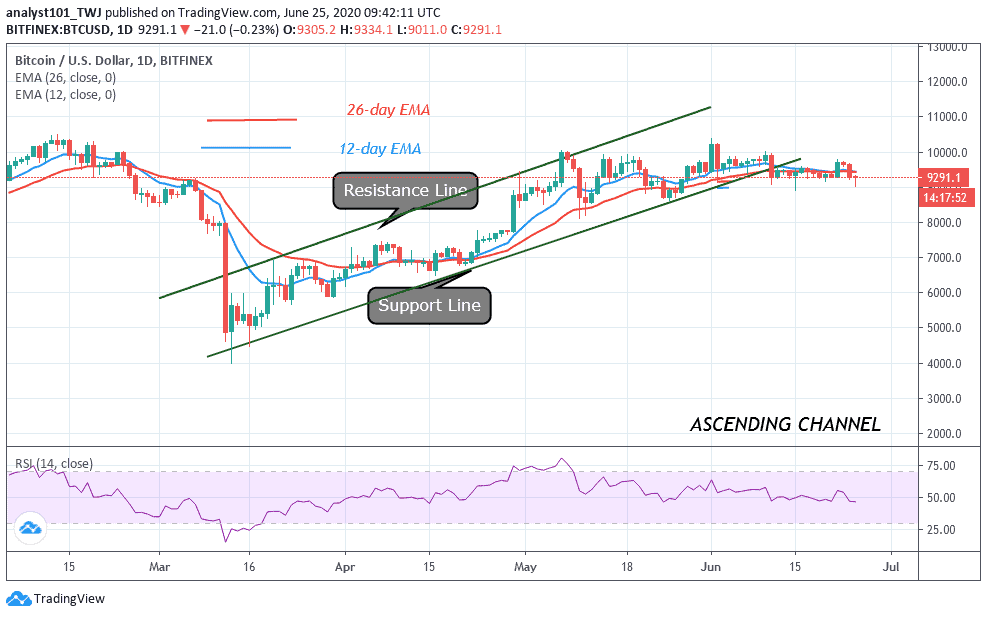
Bitcoin has fallen to the lower region between $9,000 and $9,300. The bottom line is that if the current support between $9,000 and $9,300 holds, the upside range trading will resume. Conversely, if the current support cracks the downtrend will also resume. Yesterday’s breakdown was the rejection of the $9,800 resistance. This is an indication that the bears are well fortified at the $10,000 overhead resistance. The market declined to $9,600 support to resume a sideways trend for three days. Eventually, BTC plunged to the oversold region at $9,011 low.
Buyers are emerging in the oversold region as the market moves up. It indicates that the $9,000- $9,300 support is likely to hold. Nonetheless, if the bullish momentum is sustained, price will rise to $9,300 or $9,400. This is the support region for the upside range trading. Bitcoin bulls will resume fluctuation between $9,300 and $9,800 to retest the $10,000 overhead resistance. Conversely, if the bears break the $9,011 support, BTC will find initial support at $8,800. If the selling pressure persists, the market will reach a low of $8,500 or $8,200. The Relative Strength Index period 14 is at level 44. The coin is in the downtrend zone.
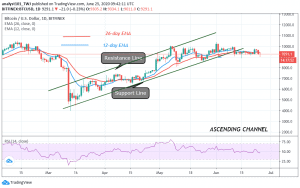
BTC/USD Medium-term Trend: Bullish (4-Hour Chart)

On the 4 hour chart, the bears broke below the downtrend line, the 12-day EMA, and the 26-day EMA. It indicates a further downward movement. The market has fallen to the oversold region suggesting buyers to emerge to push prices upward. The bulls have taken over as price reached a high of $9,291. The king coin is above 20% range of the daily stochastic. Presently, it is in a bullish momentum.
Join Our Telegram channel to stay up to date on breaking news coverage