Join Our Telegram channel to stay up to date on breaking news coverage
XRP Price Analysis – June 20
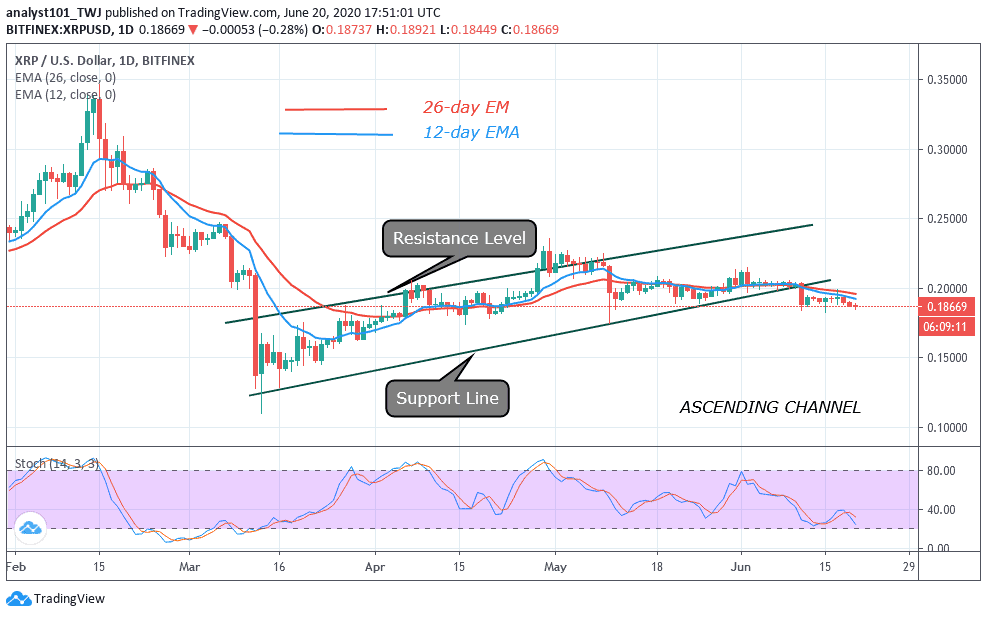
XRP/USD pair is currently trading in a tight range between $0.185 and $0.195. The market has been consolidating between those ranges since June 11. XRP/USD pair has been on a downward move since April.
XRP/USD Market
Key Levels:
Resistance Levels: $0.24, $0.26, $0.28
Support Levels: $0.22, $0.20, $0.18

Following the recent breakdown, the coin has been consolidating between $0.185 and $0.195. On June 11, Ripple dropped to the low of $0.184 as price made an upward correction. The bulls buy from the dips twice to push the coin upward. Buyers retested the $0.195 resistance twice but were repelled. The selling pressure is overwhelming as the market continues its downtrend. On the downside, if the bears break below the support at $0.185, the downtrend will continue. The current consolidation will continue if the support holds. The upward move is expected to continue to retest the initial resistance at $0.195.Presently, Ripple is below 40% range of the daily stochastic. It indicates that the market is in a bearish momentum. Meanwhile, the price action is showing a bearish signal.
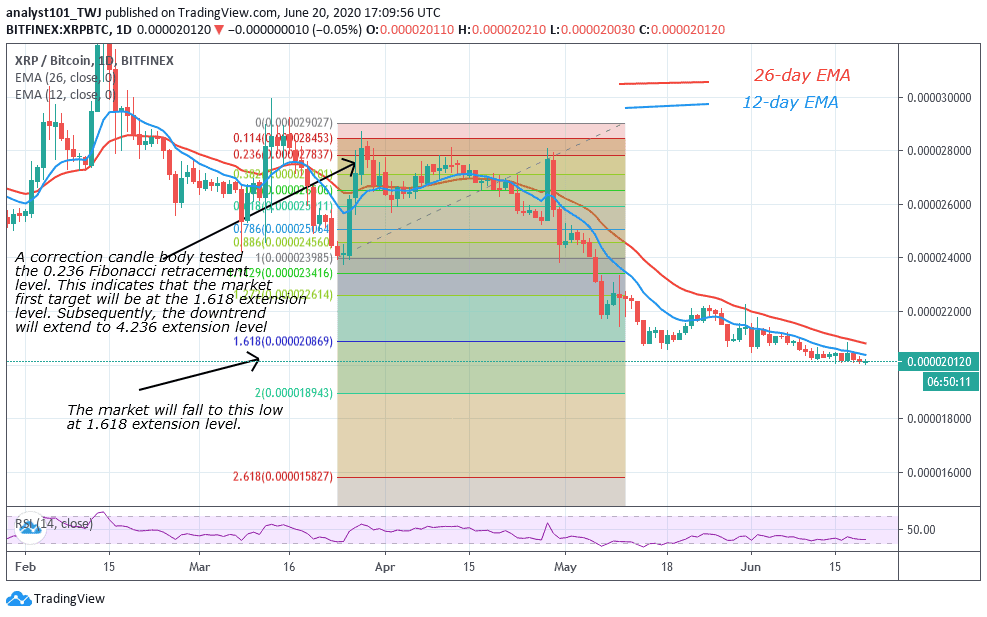
When compared with Bitcoin, XRP/BTC is still in a downtrend. A correction candle body tested the 0.236 Fibonacci retracement level.

This indicates that XRP/BTC is likely to continue downward move. The first target will be at the 1.618 extension level. In other words, it will reach a low of Ƀ0.000020120. Subsequently, the downtrend will extend to 4.236 Fibonacci extension level. Meanwhile, the pair is at level 36 of the Relative Strength Index. It indicates the price is in the downtrend zone and it is below the centerline 50. The pair is approaching the oversold region.
Join Our Telegram channel to stay up to date on breaking news coverage

