Join Our Telegram channel to stay up to date on breaking news coverage
Bitcoin (BTC) Price Prediction – June 9
BTC/USD continues trading sideways currently at $9,728 after another significant rejection from $9,882.
BTC/USD Long-term Trend: Bullish (Daily Chart)
Key levels:
Resistance Levels: $10,700, $10,900, $11,100
Support Levels: $8,900, $8,700, $8,500
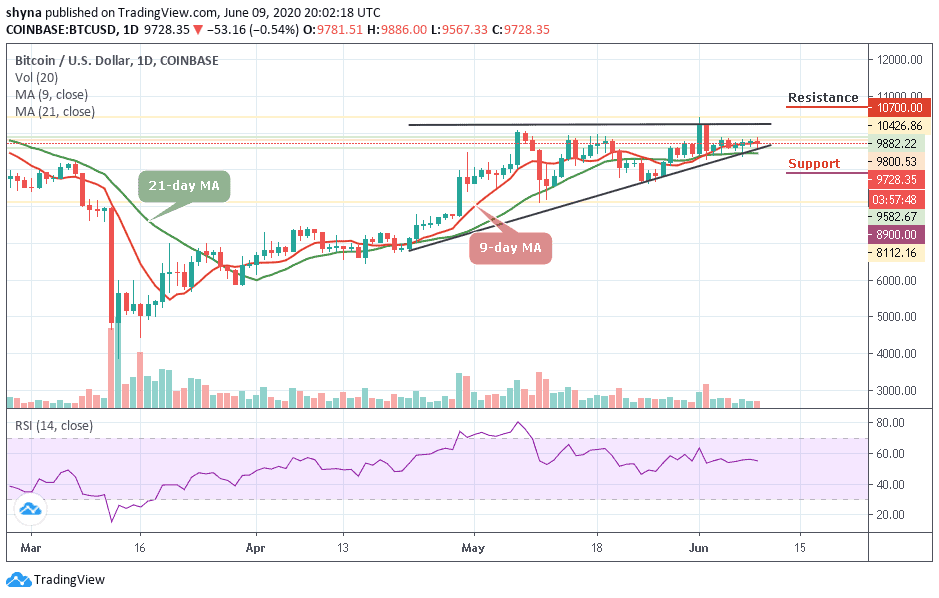
Looking at the daily chart, after three consecutive bullish days, BTC/USD is still flat and trading sideways but has seen a volatile move, peaking at around $9,882 before quickly dropping to $9,582 under the 9-day and 21-day moving averages. More so, the Bitcoin (BTC) is recovering and continues to trade sideways.
Moreover, as the coin is trading at $9,728.35 and displays an intraday loss of 0.54%. The prevailing trend is ranging from expanding volatility. The leader of cryptocurrencies continues to consolidate in a bullish flag pattern. Meanwhile, a breakout out from this pattern is supposed to continue in the direction of the previous trend. In this case, traders expect BTC/USD to rise above $10,000 resistance and could move towards the potential resistance levels at $10,700, $10,900 and $11,100.
However, should Bitcoin price failed to remain above the moving averages; the price could drop below the channel and head to the $9,400 vital support. A further low drive could send the price to $8,700, $8,500, and $8,300 support. The technical indicator RSI (14) is moving in a sideways movement, which makes the market to be indecisive at the moment.
BTC/USD Medium – Term Trend: Ranging (4H Chart)
At the opening of the market today, the Bitcoin price first went up but has dropped slightly within 24 hours, bringing its price from $9,888 to reach around $9,567. Should the price continue to drop further, it could reach the nearest support levels at $9,600, $9,400 and $9,200.
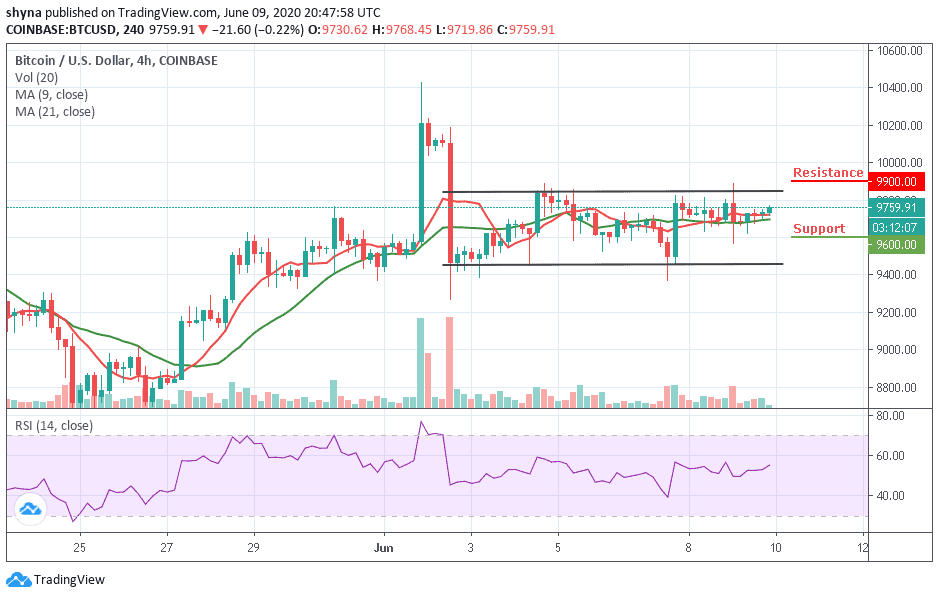
Moreover, if the bulls push the coin above the upper boundary of the channel, the Bitcoin price may likely reach the potential resistance levels of $9,900, $10,100 and $10,300. Presently, the market is indecisive as the RSI (14) indicator moves around 55-level.
Please note: Insidebitcoins.com is not a financial advisor. Do your research before investing your funds in any financial asset or presented product or event. We are not responsible for your investing results.
Join Our Telegram channel to stay up to date on breaking news coverage