Join Our Telegram channel to stay up to date on breaking news coverage
LTC Price Prediction – January 20
Litecoin (LTC) has been losing ground amid global cryptocurrency market correction. The coin is vulnerable to further losses as the daily RSI points to the south.
LTC/USD Market
Key Levels:
Resistance levels: $64, $66, $68
Support levels: $50, $48, $46

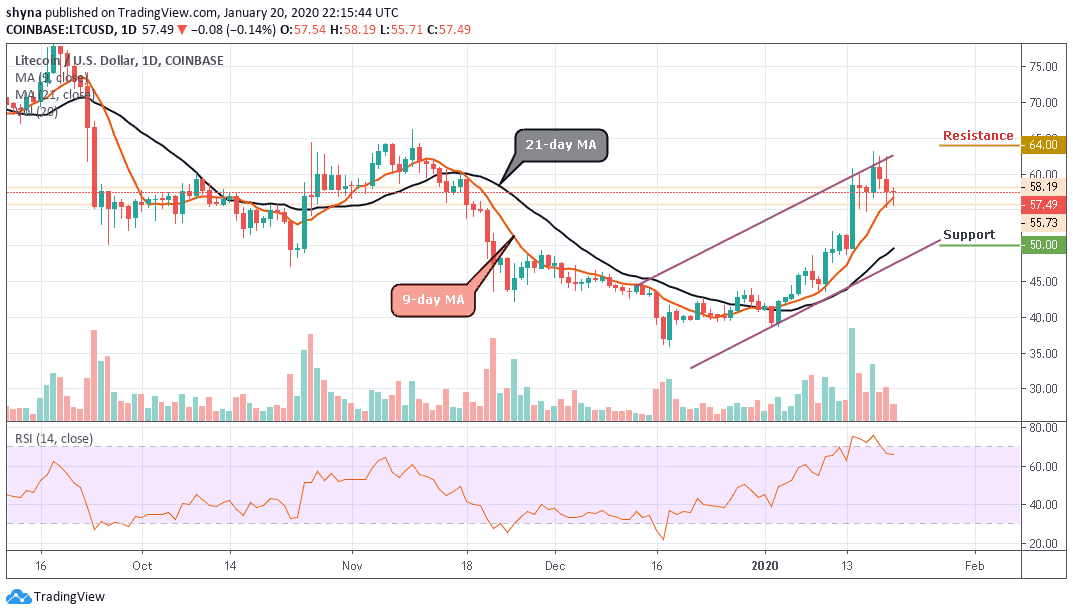
At the time of writing, LTC/USD is changing hands at $57.49, off the recent high registered at $63.16 on January 17. Currently, the coin seems to be moving in sideways within the channel. As there are no clear fundamental factors that could have influenced the price movements of Litecoin, the coin is mainly affected by speculative sentiments and technical factors. Similarly, a drop below the psychological $60 has attracted new speculative sellers to the market and increased short-term downward pressure.
However, a few days ago, LTC/USD touched an area above $63 and the upside momentum proved to be unsustainable at this stage. A wide-spread downside correction on the market pushed the coin towards $57 with the next local support created by the 9-day MA on approach to $55. Once it is broken, the sell-off may be extended towards $52 and any further movement could bring it to the critical supports at $50, $48 and $46.
On the upside, the initial resistance is created near the trend line above the moving averages at $61. We will need to see a sustainable move above this level to retest $62 and the recent high of $63.16. The ultimate bulls’ goal is created above the ascending channel at $64, $66 and $68 resistance levels. More so, considering that the technical indicator RSI (14) points to the downside, LTC/USD may be well-positioned for an extended bearish correction before another bull’s wave.
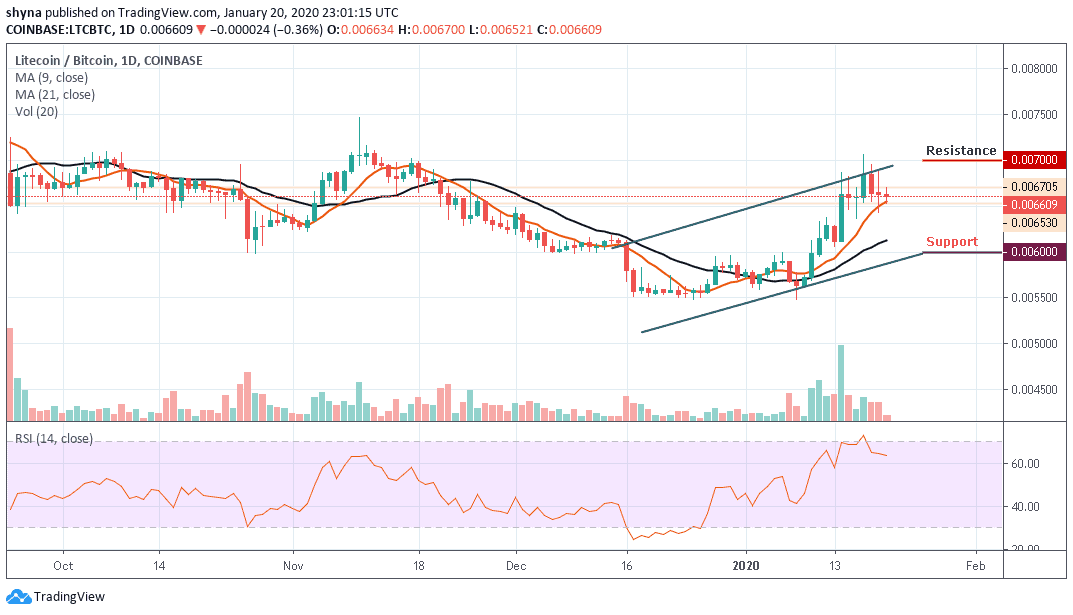
When compared with BTC, the price in Litecoin is moving in sideways above the 9-day and 21-day moving averages. The number seven crypto on the market cap is yet to define its real direction because the market movement has remained clouded by 3 consecutive red candles for the past few days.

However, as the RSI (14) nosedives to 60-level, a bearish step back may likely roll the market back to the support of 6400 SAT with a possible break down and further declines could be at 6000 SAT and below, establishing a new weekly low for the market. Meanwhile, any bullish movement above the trend line could reach the resistance levels of 7000 SAT and above.
Please note: Insidebitcoins.com is not a financial advisor. Do your research before investing your funds in any financial asset or presented product or event. We are not responsible for your investing results.
Join Our Telegram channel to stay up to date on breaking news coverage

