Join Our Telegram channel to stay up to date on breaking news coverage
Bullish reversal at $49 is possible in Zcash market
Zcash Price Analysis – October 20
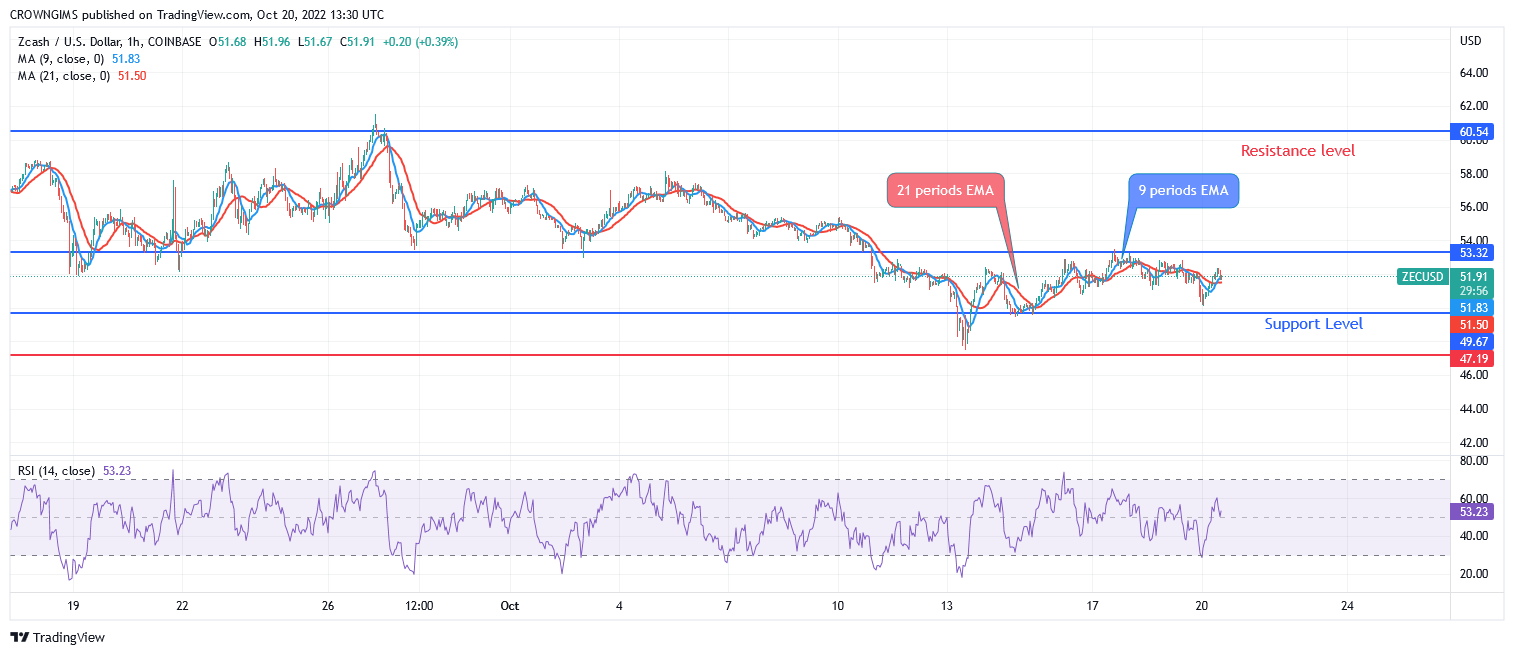
In case the support level of $49 holds, buyers may face the $53 psychological resistance level and Zcash may increase to the potential resistance levels at $60, and $69. At the lower side of the chart, sellers will face the support level at $49, $47, and $36.
Key Levels:
Resistance levels: $53, $60, $69
Support levels: $49, $47, $36
ZECUSD Long-term Trend: Bearish
Zcash is bearish in the daily chart. The bears have been dominating the market for more than two months. The price reached the high of $81 resistance level but bulls’ momentum could not break up the level. A pin bar candle pattern formed indicating that there will be a bearish reversal. It happened and the price dropped at the support level of $53. Sellers exert more pressure and the just mentioned level was broken downside and $49 level is tested.
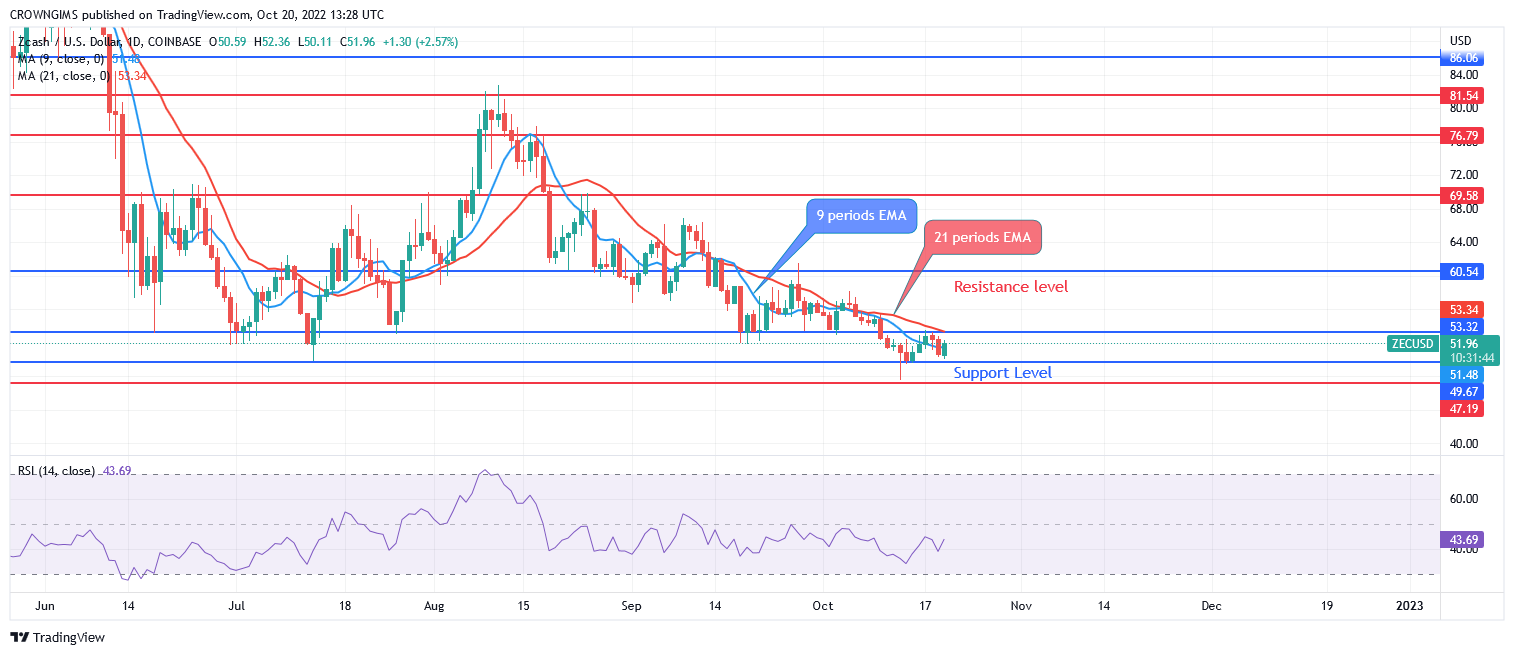
On the daily chart, ZEC/USD remains in the hands of the sellers, the price is trading below the 9 periods EMA and 21 periods EMA. In case the support level of $49 holds buyers may face the $53 psychological resistance level and may increase to the potential resistance levels at $60, and $69. At the lower side of the chart, sellers will face the support level at $49, $47, and $36.
ZECUSD Medium-term Trend: Bearish
On the 4-hour chart, Zcash is bearish. The price action was making a lower lows, lower highs on the 4-hour chart. This is a sign of downtrend. The sign came up when price was rejected at the resistance level of $81. Zcash is moving below the 9 periods EMA and 21 periods EMA as a sign of bearish momentum.
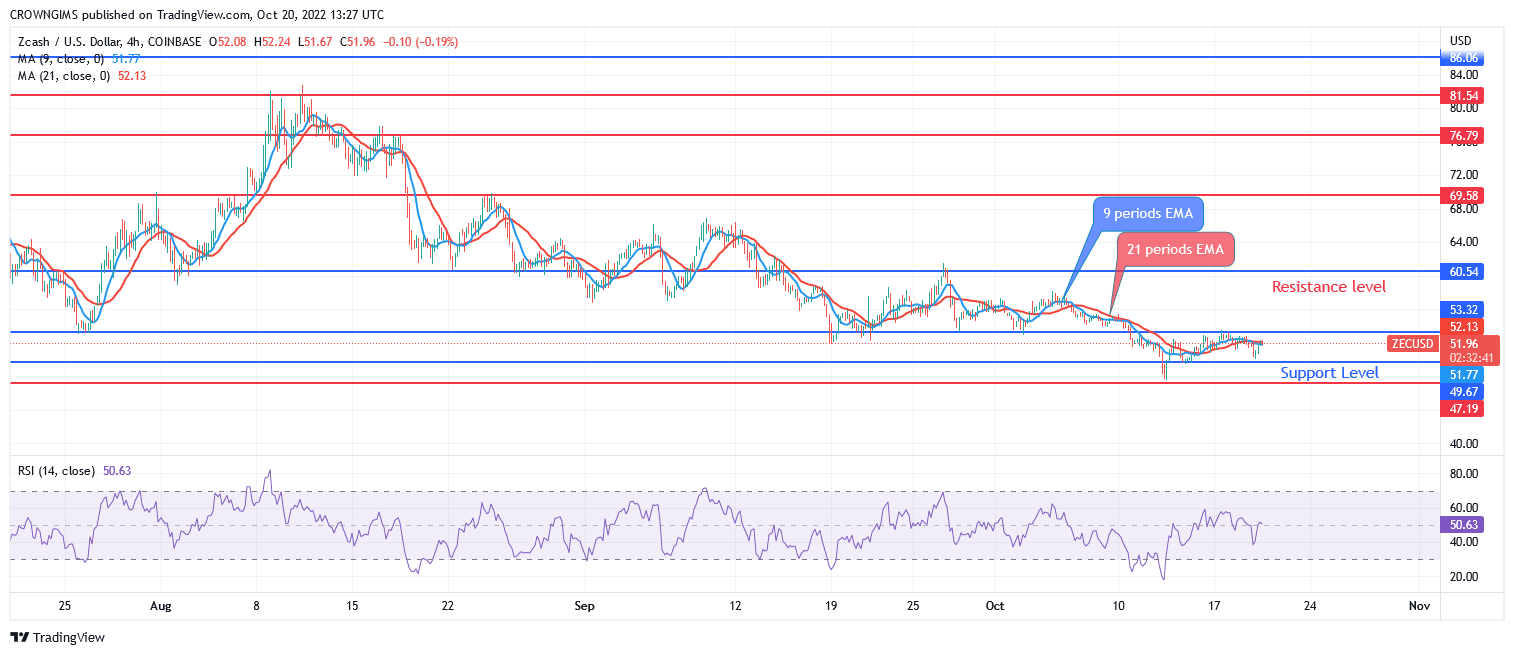
The indicator, Relative Strength Index period 14 is pointing upside to indicate a buy signal which may be a pullback. The two EMAs are interlocked and the price is trading over and around the two EMAs.
Currently, IMPT token is more than midway through its presale, and has thus far experienced dramatic success, having now raised almost $6m.
One alternative to Bitcoin is IMPT token, which is on presale now at the link below and has raised $4.5 million so far.
- Related
- How to Buy IMPT Token
Join Our Telegram channel to stay up to date on breaking news coverage