Join Our Telegram channel to stay up to date on breaking news coverage
Zcash may continue to experience a Downward trend
Zcash Price Analysis – August 27
Sellers may face the $60 psychological support level and Zcash may reduce to the potential support levels at $53, and $49. At the upper side of the chart, the buyers are facing the resistance level at $69, $76, and $81.
Key Levels:
Resistance levels: $69, $76, $81
Support levels: $60, $53, $49
ZECUSD Long-term Trend: Bearish
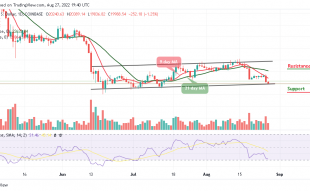
The bears are dominating over the bulls in the ZEC market, in other words, Zcash is bearish in the daily chart. Since the August 10, Zcash has been falling from the high of $81. The bearish engulfing candle formed at the level mentioned above triggered bearish momentum. The former support levels of $76 and $69 have turned to resistance levels. The price is currently testing the support level of $61.
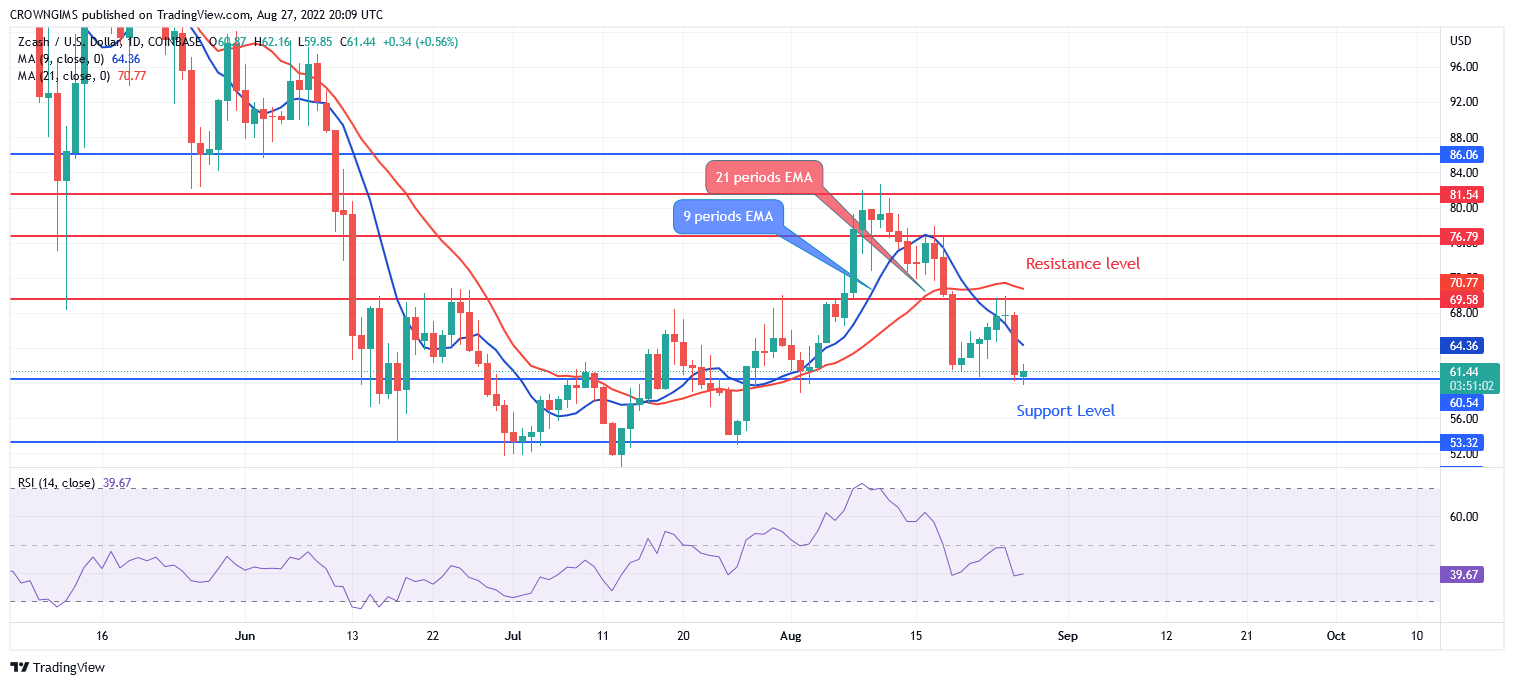
According to the daily chart above, technically ZEC/USD is already in the hands of the sellers as the price is trading below the 9 periods EMA and 21 periods EMA at distance. Nevertheless, sellers may face the $60 psychological support level and may reduce to the potential support levels at $53, and $49. At the upper side of the chart, the buyers are facing the resistance level at $69, $76, and $81.
Your capital is at risk
ZECUSD Medium-term Trend: Bearish, The Bias on Tamadoge Is Upbeat
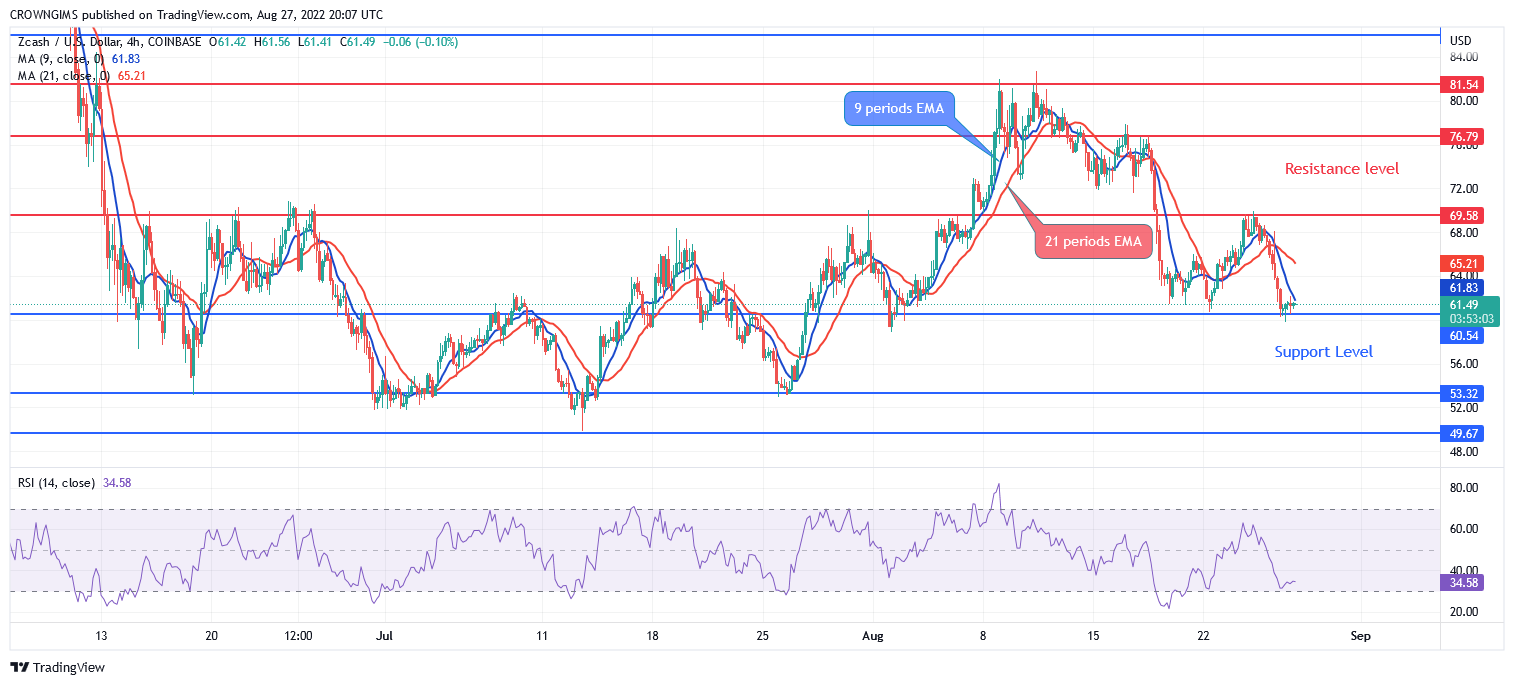
On the 4-hour chart, the price increase was rejected at the resistance level of $81. It bounces off and breaks down the $76 and $69 price levels. The price is seen to be moving below the 9 periods EMA and 21 periods EMA as a sign of an increase in bearish momentum. Meanwhile, if the price breaks down the support level at $60, then, the market may continue to experience a downward trend that could touch the nearest support level at $53 and $49.

The indicator Relative Strength Index period 14 confirms that the market is moving down with the signal line pointing down at 33 levels.
Tamadoge sold for 1 USDT to 100 TAMA (1 TAMA = 0.01) in the first phase, in which a beta sale of 200 million tokens were made available to the public. Since then there have been successive sale tranches of 100 million tokens. Half of the tokens on offer in the presale have now been sold. In total 1 billion TAMA tokens are up for sale, with the price rising on each occasion. TAMA has a total supply of 2 billion, so early bird buyers in the presale are able to purchase a generous 50% of supply. Tranche prices will keep rising until the price reaches $0.03, equivalent to 3 times the initial beta sale price. The next price to beat is in the sixth phase when 1 USDT buys 44.44 TAMA.
Related
Join Our Telegram channel to stay up to date on breaking news coverage