Join Our Telegram channel to stay up to date on breaking news coverage
Ripple Price Prediction – May 10
Ripple (XRP) continues to battle with the $1.55 level after being supported by the 9-day moving average.
XRP/USD Market
Key Levels:
Resistance levels: $2.0, $2.2, $2.4
Support levels: $1.0, $0.8, $0.6
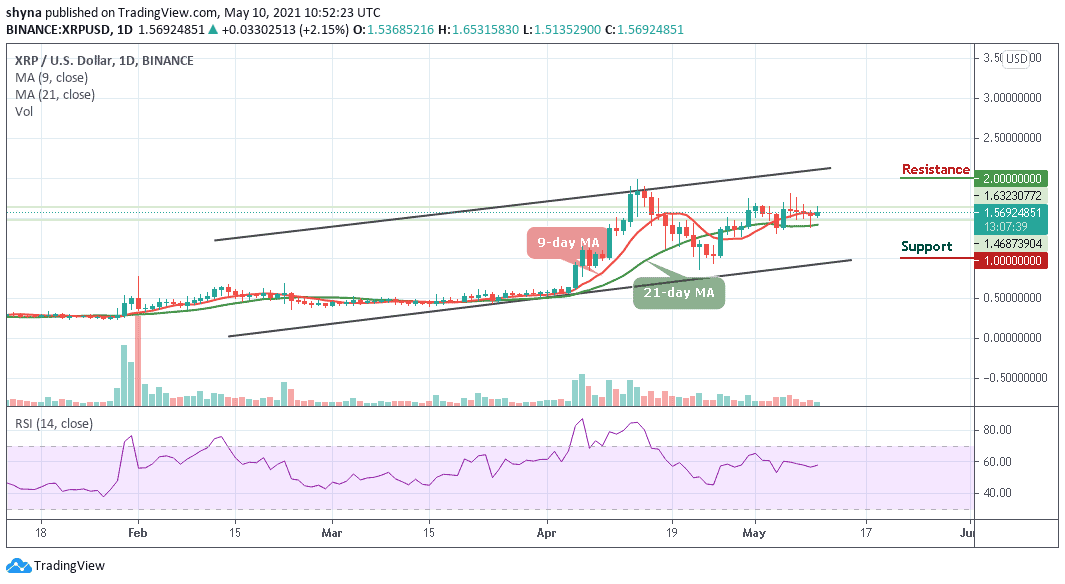
At the time of writing, XRP/USD is seen trading at $1.56 around the 9-day moving average. The Ripple (XRP) is moving sideways as it continues to struggle above the moving averages. More so, the attempt to keep the upward movement shows that the bulls are battling to be in control of the market momentum.
Ripple Price Prediction – Up or Down?
From above, the nearest level of resistance lies at the $1.70 resistance level. Any additional movement above this could reach the important resistance level at $1.80. If the bulls can break above $1.90, higher resistance is located at $2.0, $2.2, and $2.4. Meanwhile, if the price decides to cross below the moving averages, the nearest support to reach is located at the $1.40 level. Beneath this, further supports could be located at $1.0, $0.8, and $0.6.
However, the technical indicator Relative Strength Index (14) is currently moving below 60-level as traders wait for a bullish crossover to push the market higher. More so, the coin may stay within the positive side in as much as the 9-day MA remains above the 21-day MA.
Against Bitcoin, it can be seen that XRP has been struggling to hold grounds above the 9-day moving average as it currently trades at around 2645 SAT. Mere looking at it from above, the nearest resistance level lies toward the upper boundary of the channel. However, if the buyers push the Ripple (XRP) above 3000 SAT, the higher resistance level will be located at 3200 SAT and above.
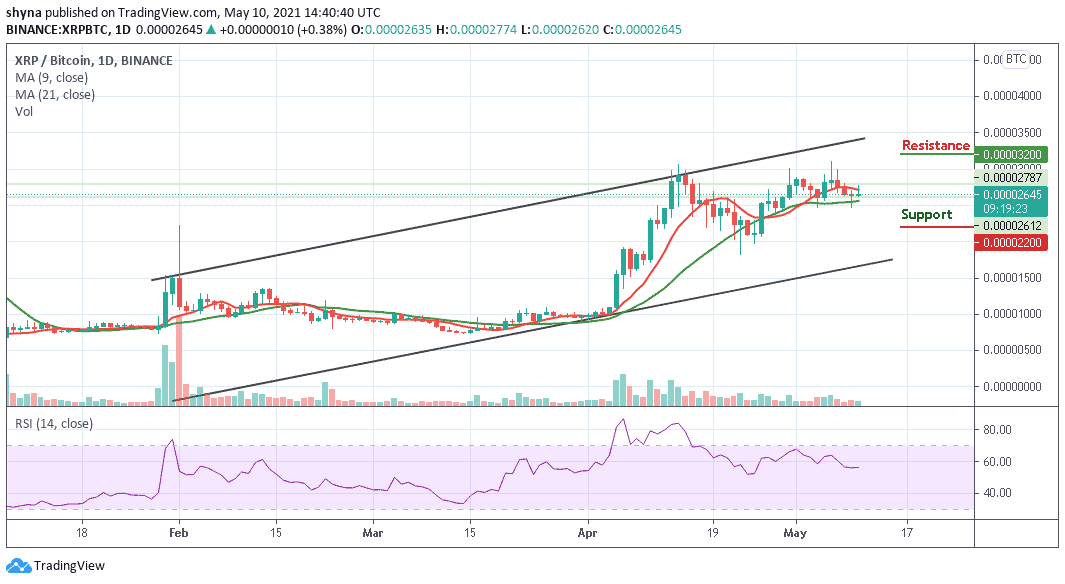
Moreover, the market price may likely cross below the green-line of the 21-day moving average in order to give bearish signals, if the downtrend movement continues and crosses below the moving averages, this can lead to the support level of 2200 SAT and below. Meanwhile, the market may move sideways as the technical indicator Relative Strength Index (14) remains below the 60-level.
Looking to buy or trade Ripple (XRP) now? Invest at eToro!
75% of retail investor accounts lose money when trading CFDs with this provider
Join Our Telegram channel to stay up to date on breaking news coverage