Join Our Telegram channel to stay up to date on breaking news coverage
XRP Price Prediction – May 2
Despite dropping sharply today, the price Ripple (XRP) is up by almost 50% over the past few days.
XRP/USD Market
Key Levels:
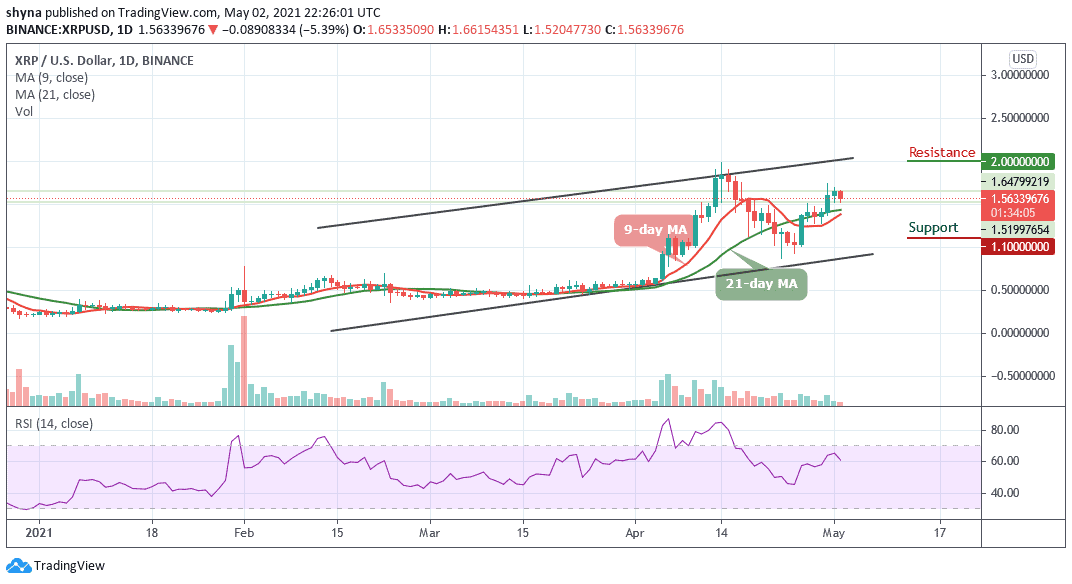
Resistance levels: $2.00, $2.10, $2.20
Support levels: 1.10, $1.00, $0.90
XRP/USD is now down at a low not seen since April 26. The weakness of Ripple (XRP) is quite apparent now as the digital asset will have very little support on the way down to $1.45. Traders should take note that most of the market is also seeing red numbers, major coins have been holding on quite well. XRP bulls will now need to see a bounce from any support level to have any chance to recover their daily uptrends.
What is the Next for Ripple (XRP)
Looking at the daily chart, if the Ripple (XRP) fails to climb above the $1.65 and $1.70 resistance levels, there could be a bearish reaction. At the moment, the initial support is near below the 9-day and 21-day moving averages. Therefore, if there is a downside break below this barrier, the price could test $1.30. Any further losses might start another bearish wave and the price could even decline below the $1.10, $1.00, and $0.90 support levels.
However, as the technical indicator RSI (14) moves to cross below the 60-level, the nearest resistance level is around the $1.75 level which the price might cross above the upper boundary of the channel. This bullish movement may likely hit the potential resistance levels at $2.00, $2.10, and $2.20 respectively.
Against Bitcoin, the Ripple price declines toward the support level of 2700 SAT. The price is set to test 2500 SAT if Bitcoin (BTC) continues to impact the XRP price. The bearish scenario may step back into the market as the technical indicator RSI (14) nosedives below 65-level.

However, if the sellers occupy their positions, the XRP price may drop below the moving averages to hit the support level of 2300 SAT and below. Therefore any bullish movement above the upper boundary of the channel could give the bulls another chance to push the coin to the upside. Any further positive movement could hit the resistance levels at $3400 and above.
Join Our Telegram channel to stay up to date on breaking news coverage