Join Our Telegram channel to stay up to date on breaking news coverage
BCH Price Prediction – May 1
The Bitcoin Cash price is seen moving sideways with the short-term outlook ranging well within the channel.
BCH/USD Market
Key Levels:
Resistance levels: $1200, $1250, $1300
Support levels: $800, $750, $700

According to the daily chart, BCH/USD is in the hands of the bulls at the time of writing. However, due to lack of enough buying power, bulls could not sustain higher growth leading to a retest of the broken support area at $977. Meanwhile, the technical indicator RSI (14) is pointing towards a domineering sideways trading action in the coming sessions. Looking back at the recent dip, recovery has been steady but acutely limited under $1000.
Where is BCH Price Going Next?
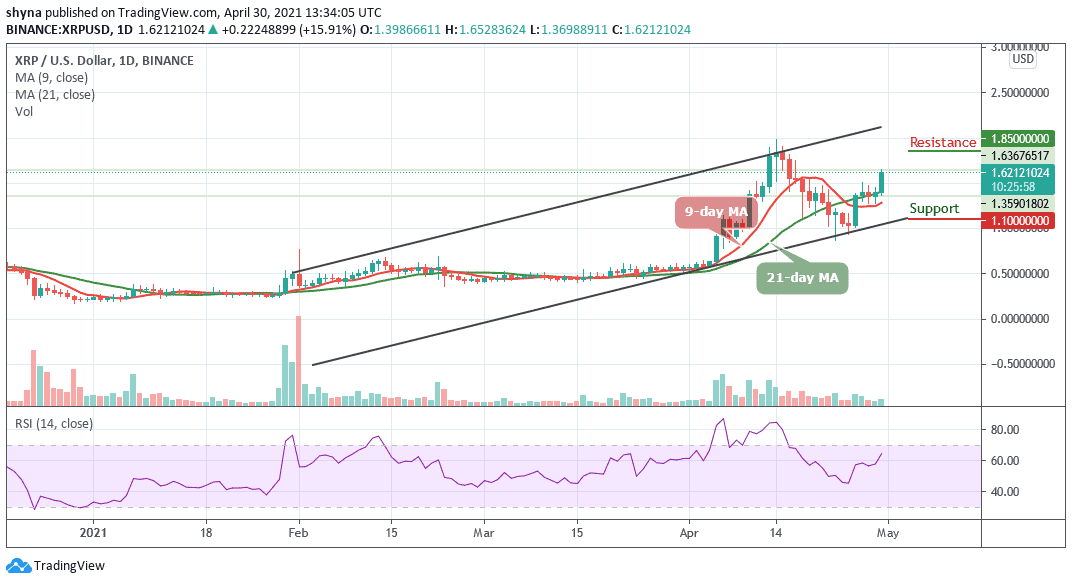
BCH/USD is trading at $999.81. The immediate downside is protected by the support level of $950. Besides, the range support at $900 is a key to the BCH trading. Other critical areas to watch include the supports at $800, $750, and $700. Looking at it technically, sideways trading action could dominate the current session and this may continue in the coming sessions.
However, following the recent price, BCH/USD is currently facing a potential resistance at $1000 level above the moving averages but a break above this barrier is likely to produce a huge green candle to the upside, which could hit the resistance levels at $1200, $1250, $1300.
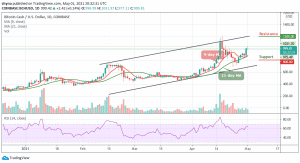
Against BTC, the market is back above the 9-day and 21-day moving averages. At the time of writing, BCH is seen pushing the price upward as it is currently trading at 1729 SAT. If the Bitcoin cash crosses above the upper boundary of the channel, it may likely meet resistance at 2000 SAT and above.

Meanwhile, looking at the daily chart, we can say that the market price is likely to continue the upward movement as the technical indicator RSI (14) prepares to cross into the overbought region while the signal line moves around 67-level. More so, should Bitcoin Cash drops below the moving averages, it may find support at 1500 SAT and below.
Join Our Telegram channel to stay up to date on breaking news coverage