Join Our Telegram channel to stay up to date on breaking news coverage
XRP Price Prediction – April 23
The Ripple price is currently facing selling pressure below the $1.22 resistance level.
XRP/USD Market
Key Levels:
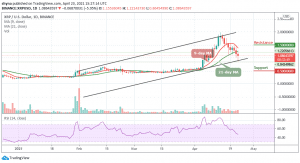
Resistance levels: $1.50, $1.70, $1.90
Support levels: $0.50, $0.30, $0.10

XRP/USD is slowly declining below key support of $0.90 after touching the daily high of $1.22 in the early trading session of today. The Ripple price might revisit the $0.55 support before it could start another increase. After struggling to stay above $1.10, Ripple started a slow and steady decline as the coin trades below the key $0.1.20 support level to move into a short-term bearish zone.
Would Ripple (XRP) Go Up or Down?
XRP/USD is currently changing hands at $0.1.08 and any attempt to make it cross below the lower boundary of the channel may open the doors for more downsides and the price could spike below the $0.60 support level. However, any bullish movement may likely cross above the 9-day and 21-day moving averages at $1.45 before creating a new bullish trend at the resistance levels of $1.50, $1.70, and $1.90.
Moreover, the market may experience a quick buy once the trade reaches the support at $0.55 And should the price fails to rebound, then a bearish breakout is likely to trigger more selling opportunity for traders, which might cause the price to drop to $0.50, $0.30, and $0.10 support levels respectively. The RSI (14) is likely to cross below 45-level to increase the downtrends.
Against Bitcoin, XRP is currently trading at the 2193 SAT and it is now trading above the 21-day moving average. If the above-mentioned level could serve as market support, the price can be pushed up above the 9-day moving average and move towards the resistance levels of the 28 SAT and above.
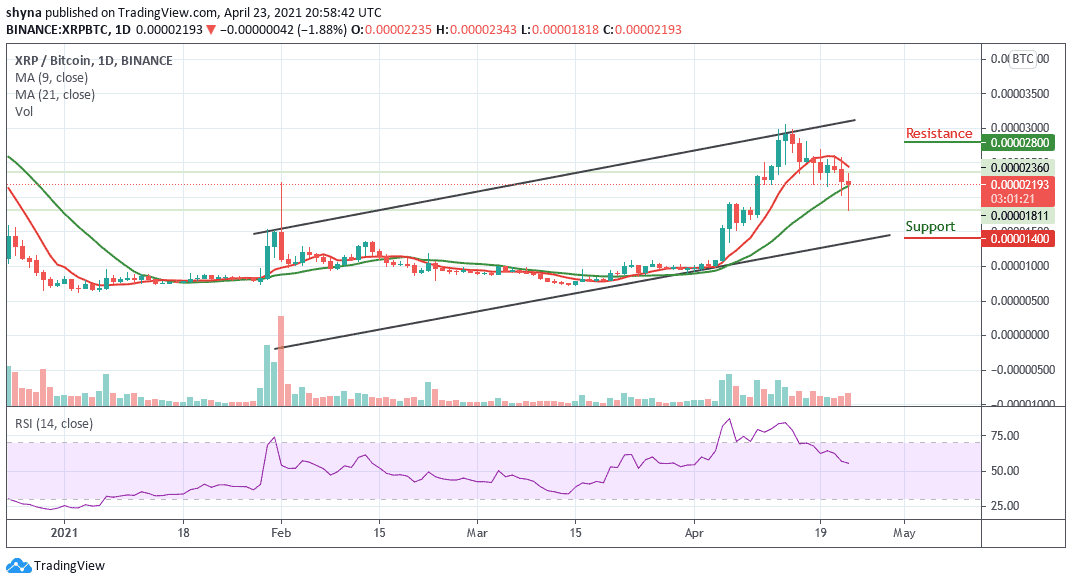
However, if the bulls fail to push the price to the nearest resistance, the market may continue the downtrend and it could probably record further declines at the 2000 SAT. Breaking this level could push the market to the nearest support levels, at 1400 SAT and below. Meanwhile, the RSI (14) is facing the south to confirm the bearish signals.
Join Our Telegram channel to stay up to date on breaking news coverage