Join Our Telegram channel to stay up to date on breaking news coverage
XRP Price Prediction – March 29
The Ripple (XRP) may soon experience a new higher high as its price continues to move towards the resistance level of $0.60.
XRP/USD Market
Key Levels:
Resistance levels: $0.62, $0.64, $0.66
Support levels: $0.47, $0.45, $0.43
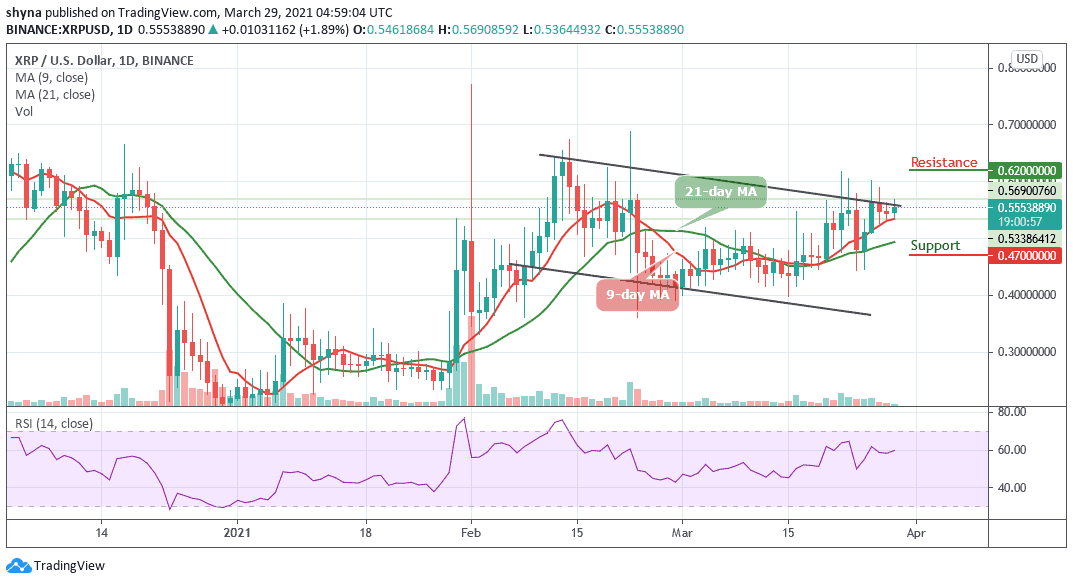
At the time of writing, the price movement is in the hand of bulls as a slight price increase is seen for XRP/USD. The coin is currently trading at $0.55 and a breakout above this point may drive the Ripple price towards the higher level of $0.60. However, the market price is also hovering above the 9-day and 21-day moving averages which confirms that bulls are still in-charge of market control.
What to Expect from Ripple (XRP)
According to the daily chart, the Ripple (XRP) needs to crack $0.60 for good. Meanwhile, XRP/USD has pierced through the critical resistance level at $0.56 in the past few days but has not been able to close above it. On the other hand, the coin may likely cross below moving averages which could send the price to $0.48, and breaking this barrier may push it to the support levels of $0.47, $0.45, and $0.43 respectively.
However, the buyers need to make a sustainable move above $0.60 as soon as possible to resume the upward trend. Meanwhile, for the upside to gain traction, XRP/USD needs to regain ground above $0.61, while $0.62, $0.64, and $0.66 resistance levels are the ultimate aims for the bulls.
Against Bitcoin, the Ripple (XRP) has been slowly grinding higher as the technical indicator RSI (14) is making an attempt to recover above 60-level. The price begins to slowly ascend and it’s currently trading around the 1005 SAT. The Ripple price is now contained within the descending channel as traders wait for bulls to hopefully push the price above the 9-day and 21-day moving averages.
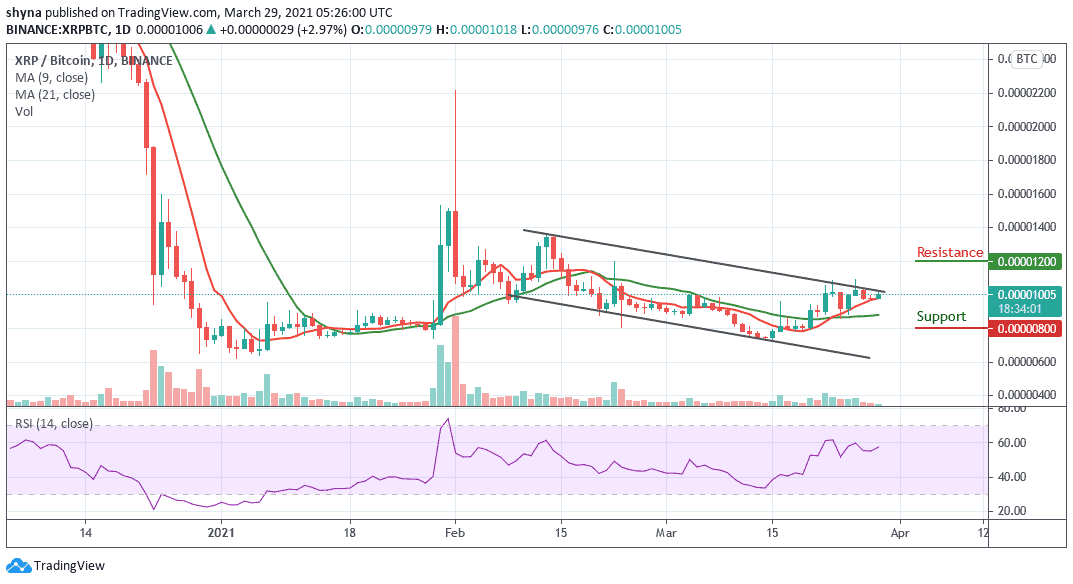
However, if the bulls break above the upper boundary of the channel, we can expect initial resistance at 1100 SAT. Above this, higher resistance lies around the 1200 SAT and above. From the downside, if the sellers drag the market price beneath the moving averages, we may expect support at 800 SAT and below.
Join Our Telegram channel to stay up to date on breaking news coverage