Join Our Telegram channel to stay up to date on breaking news coverage
ETH Price Prediction – March 28
The Ethereum price is on the verge of a breakdown to $1500, mostly if the support at $1600 fails to hold
ETH/USD Market
Key Levels:
Resistance levels: $1900, $2000, $2100
Support levels: $1500, $1400, $1300
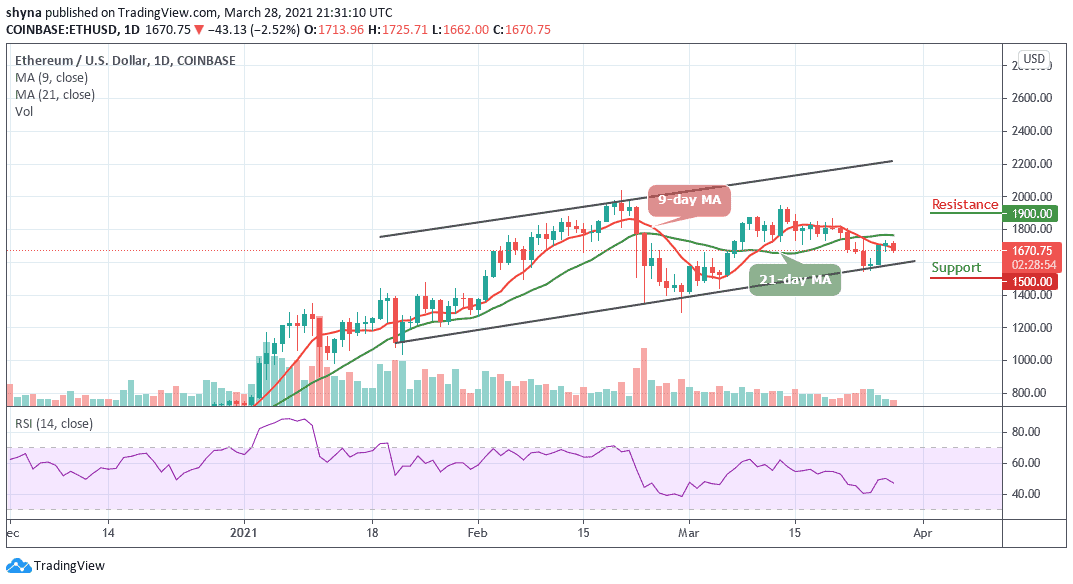
ETH/USD is in the middle of a retreat that could soon touch $1600 following a failed attempt to recover to $1800. The coin is teetering at $1670.75 amid fresh declines from the recent rejection at $1725. ETH/USD might complete the bearish leg to $1550 if a crucial support area is depressed. Meanwhile, the technical indicator RSI (14) may stay under 50-level, suggesting more bearish signals.
Where is ETH Price Going Next?
The bearish outlook may be abandoned if Ethereum closed the day above $1700 and perhaps reclaimed the ground past $1800. Meanwhile, the 9-day moving average seems to be holding the fort, allowing bulls to flex their muscles. This zone, in conjunction with the immediate support at $1600, must hold to ensure that potential losses to $1550 are averted. In addition, if the coin drops below the lower boundary of the channel, it could hit the supports at $1500, $1400, and $1300.
Moreover, it is worth noting that, the bearish outlook could be invalidated if Ethereum defends the immediate support area. However, the upward price action might push the price of Ethereum above the 9-day and 21-day moving averages. Meanwhile, trading above $1800 is likely to encourage more buyers to join the market, thereby pulling the price to the potential resistance levels of $1900, $2000, and $2100.
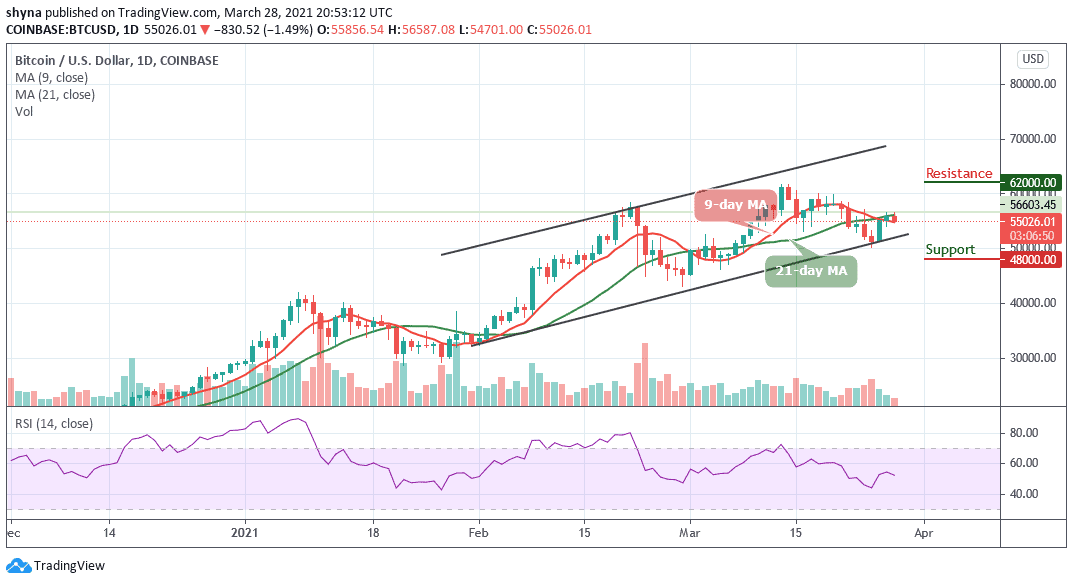
When compares with Bitcoin, the Ethereum price is seen moving sideways as the pair trades below the 9-day and 21-day moving averages. The price begins to fall and the RSI (14) indicator nosedives below 40-level, which might be considered as more downtrends for the market.

On the other hand, ETH/BTC may continue to decline if the bears put more pressure on the buyers. Therefore, any further bearish movement may push the price towards the lower boundary of the channel which may likely hit the support levels of 2700 SAT and below. Meanwhile, if there is a rebound, the Ethereum price may likely cross above the moving averages to hit the resistance level of 3400 SAT and above.
Join Our Telegram channel to stay up to date on breaking news coverage