

Join Our Telegram channel to stay up to date on breaking news coverage
XRP Price Prediction – March 26
The Ripple (XRP) is currently pushing higher with 8.03% gains as the coin climbs above the $0.55 level.
XRP/USD Market
Key Levels:
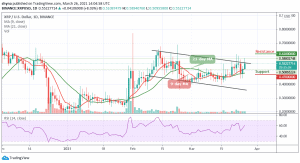
Resistance levels: $0.62, $0.64, $0.66
Support levels: $0.47, $0.45, $0.43

At the time of writing, XRP/USD reaches a high of around $0.58 as the price moves above the upper boundary of the channel. A few weeks ago, Ripple was seen trading sideways but the push higher today allows XRP/USD to hit its daily high. This bounce above the 9-day and 21-day moving averages shows that the buyers are now in control of the market movement.
Where is XRP Price Going Next?
If the Ripple bulls want to maintain this newly upward momentum, they should hold the price above the channel and they may need to convert both the 9-day and 21-day moving averages into support levels and continue trading upwards until they stay fully above the channel. However, a bullish breakout above this barrier could take the Ripple price up to the potential resistance levels of $0.62, $0.64, and $0.66 as the RSI (14) crosses above the 60-level.
Moreover, XRP/USD is trading at $0.55 after touching the daily high at $0.58. In other words, a drop beneath $0.50 support may cause the Ripple price to spiral downward and head beneath the $0.48 level. On the downside, the local support may be created on approach to $0.47. If it is broken, the sell-off may be extended to critical supports at $0.45 and to psychological $0.43 respectively.
When compares with Bitcoin, the Ripple price has been slowly grinding higher within the channel. The price begins to slowly ascend and is currently trading around the 1038 SAT. the Ripple’s price is now contained within the descending channel as traders wait for the bulls to hopefully keep the price above the 9-day and 21-day moving averages.

Moreover, if the bulls can break above the upper boundary of the channel, traders can expect initial resistance at 1200 SAT. Above this, higher resistance lies at the 1300 SAT and above. From the downside, if the sellers push the market beneath the moving averages, traders can expect supports at 800 SAT and below. Meanwhile, the technical indicator RSI (14) is crossing above the 60-level and it is likely to follow an upward movement.
Join Our Telegram channel to stay up to date on breaking news coverage
