Join Our Telegram channel to stay up to date on breaking news coverage
XRP Price Prediction – March 13
For the past few days, Ripple (XRP) has been unable to develop the upside momentum above $0.50.
XRP/USD Market
Key Levels:
Resistance levels: $0.55, $0.60, $0.65
Support levels: $0.27, $0.25, $0.23
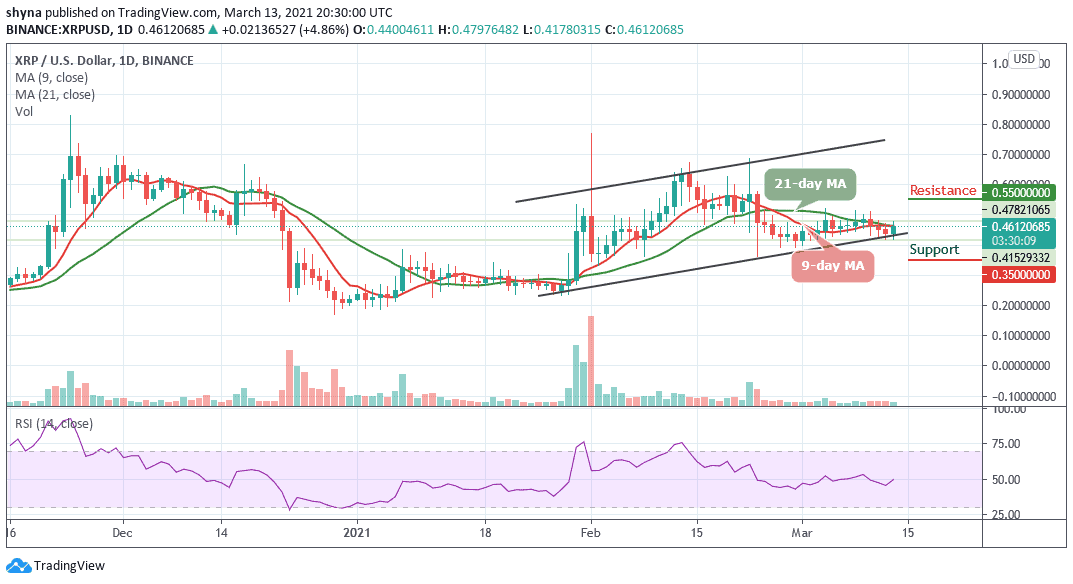
XRP/USD trades near the resistance level of $0.50 at the opening of the market today, but failed to hold the ground and retreated quickly towards $0.45 at the time of writing. However, the Ripple (XRP) has stayed mostly unchanged both on a day-to-day basis and since the beginning of today. XRP/USD now remains at a tight range that limited its bullish movements since late last month.
What to Expect from Ripple
XRP/USD commences an intriguing recovery towards a $0.50 resistance level. The initial break above the 9-day moving average may boost the price farther up. The Ripple (XRP) hit a daily high of $0.48 before retreating back to where it is currently trading. Meanwhile, from above, more hurdles may come into play towards the upper boundary of the channel and of course, the nearest resistance level is located at $0.48.
However, the short-term trend remains in the hands of the bulls supported by the technical indicator where the RSI (14) is about crossing above 50-level, building on the consistent recovery from the downside recorded sometimes ago. Nevertheless, a break above $0.55 and $0.60 resistance levels may most likely push the coin above the potential $0.65 resistance level while a break below the channel may lead to the supports at $0.35, $0.30, and $0.25 respectively.
Against Bitcoin, the pair is consolidating to the downside and moving below the 9-day and 21-day moving averages. However, the bulls have failed to push the price above the moving averages. Should in case they break above this barrier, the market price may likely hit the resistance level of 950 SAT and above.
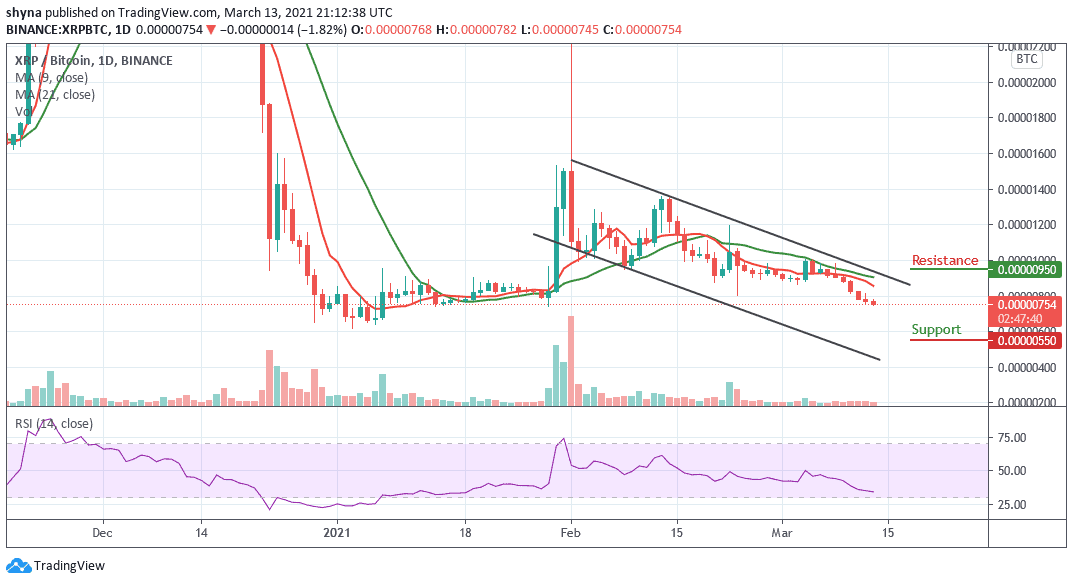
However, if the coin continues to follow the downtrend, then it may send the price to the critical support at 550 SAT and below. Meanwhile, the technical indicator RSI (14) is moving below the 40-level, suggesting more bearish signals.
Join Our Telegram channel to stay up to date on breaking news coverage