Join Our Telegram channel to stay up to date on breaking news coverage
XRP Price Prediction – February 28
XRP/USD, at the time of penning down this, is seen hovering around $0.414 Support.
XRP/USD Market
Key Levels:
Resistance levels: $0.55, $0.60, $0.65
Support levels: $0.30, $0.25, $0.20

XRP/USD price is seen correcting downwards after having hit the resistance at $0.44. Meanwhile, Bitcoin is also seen trading below $44,000 and has an impact on the overall trading volume and market cap as well. Currently, the coin is exhibiting an intraday dip and bearish move, alongside, lack of support.
Where is Ripple Price Going Next?
However, the daily chart reveals that the coin is seen correcting downwards, trading near the lower boundary of the channel. Unable to hit the resistance, the coin is moving towards the major support at $0.40. But once the coin rightly gains the required momentum, it is ought to bounce back and retest the formed resistance.
At the moment, the technical indicator RSI (14) faces the south with its signal line moving below the 45-level. Should the bulls prevail over the bears by moving the price back above the moving averages, XRP/USD pair may rally towards the $0.55, $0.60, and $0.65 resistance levels; but if the bears continue to push the price below the channel; the price could find its low at the support levels of $0.30, $0.25, and $0.20 respectively.
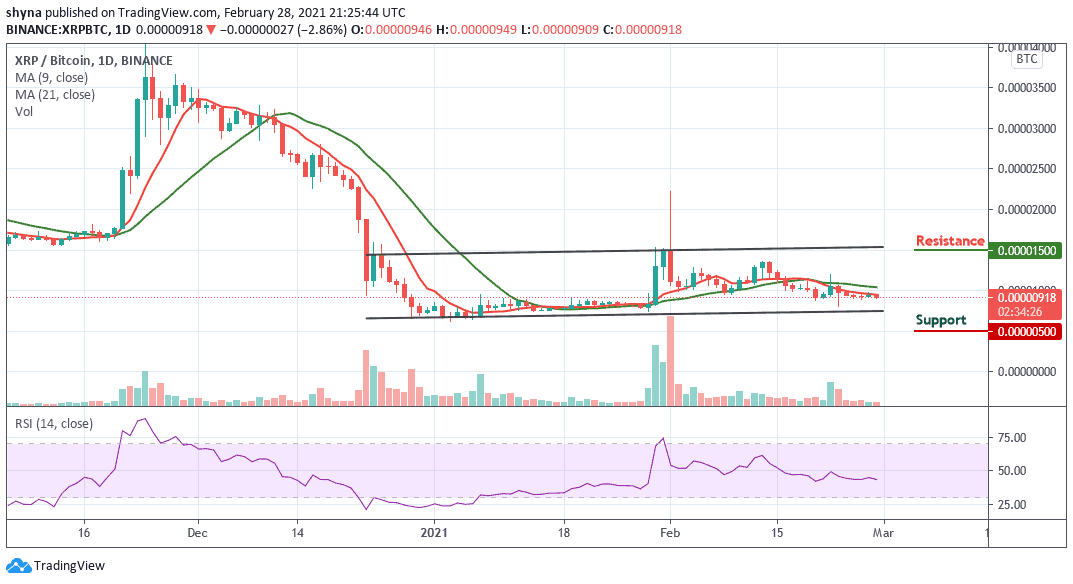
When compares with Bitcoin, the Ripple market price is ranging and trading within the channel since the beginning of this year. For now, it is trading at 918 SAT and expecting a break below the lower boundary of the channel. Looking at the chart, both the bulls and the bears are struggling with who will dominate the market.

However, should the market make attempt to fall below the channel, the next key supports could be 500 SAT and below. Meanwhile, on the bullish side, a possible rise could take the market to the resistance level of 1500 SAT and above. According to the technical indicator RSI (14), the market is indecisive as the price is still moving sideways.
Join Our Telegram channel to stay up to date on breaking news coverage

