Join Our Telegram channel to stay up to date on breaking news coverage
XRP Price Prediction – January 3
XRP/USD is clinging to small daily gains today as the coin touches the daily high at $0.238.
XRP/USD Market
Key Levels:
Resistance levels: $0.40, $0.45, $0.50
Support levels: $0.045, $0.025, $0.005
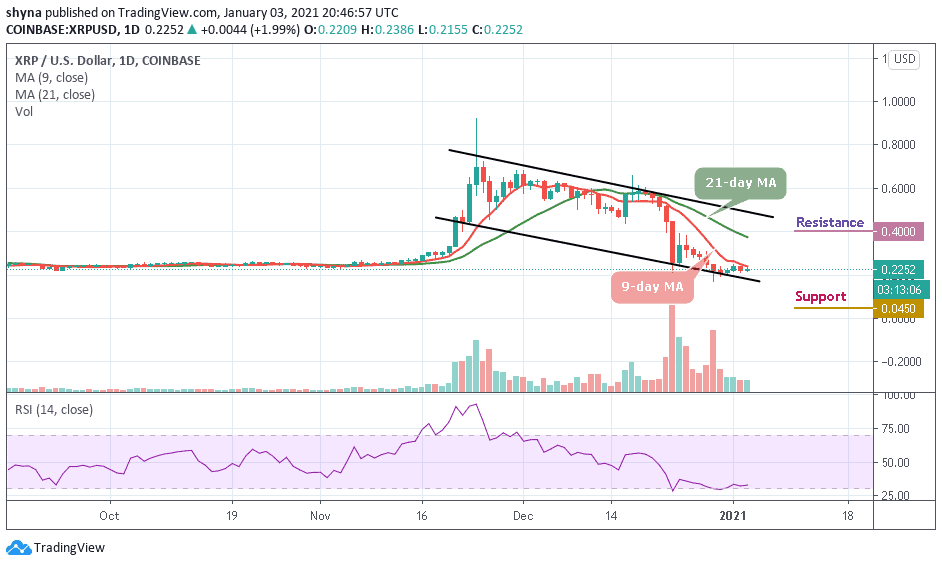
XRP/USD has been declining slowly below the key support as the technical indicator RSI (14) remains at the downside, the Ripple price might need to revisit the $0.15 support before it could start a new increase. More so, after struggling to stay above $0.24, the coin started a slow and steady decline last year as it moves below the 9-day and 21-day moving averages at the $0.51 support level moving into a short-term bearish zone.
What to Expect from Ripple (XRP)
XRP/USD is currently exchanging hands at $0.22 and any attempt to make it cross below the lower boundary of the channel could open the doors for more downsides and the price could spike below the $0.20 support level. However, traders should keep an eye on the $0.15 and $0.10 before creating a new monthly low at $0.045, $0.025, and $0.005 support levels.
Furthermore, the market may experience a quick buy once the trade reaches the support at $0.20. Therefore, if the price breaks to the upside and successfully moves toward the north, then a bullish breakout is likely to trigger more buying opportunity for traders, which might cause the price to hit $0.30 and further movement may take it to $0.40, $0.45, and $0.50 resistance levels.
When compares with Bitcoin, the Ripple (XRP) is consolidating within the channel as the price remains below the 9-day and 21-day moving average. The buyers are trying to push the price back above the moving average and the bullish continuation may take it to the resistance levels of 1350 SAT and above.
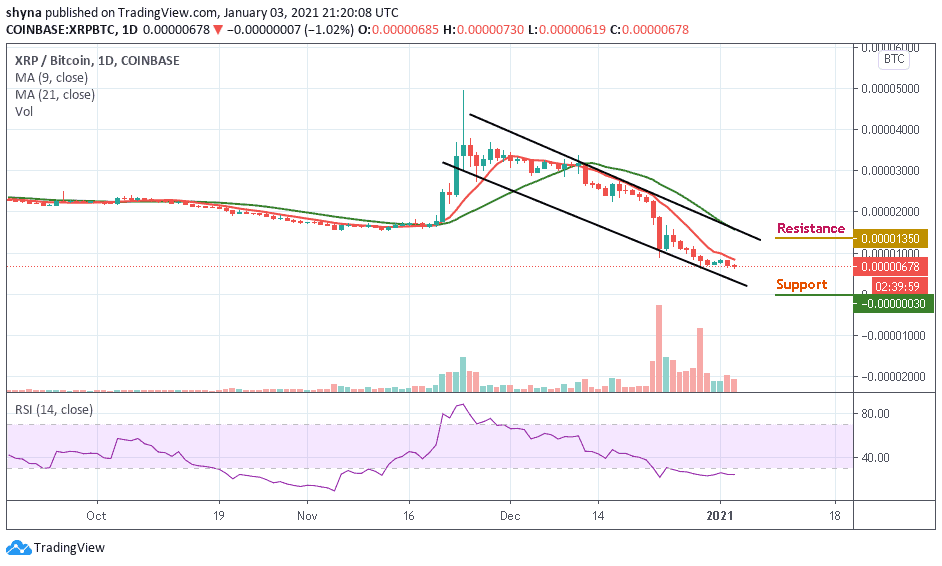
Looking at the daily chart, if the bulls fail to hold the price tight by pushing it upward, then the coin may continue to fall below the lower boundary of the channel. The nearest support levels lie at 0030 SAT and below while the technical indicator RSI (14) moves within the oversold zone, suggesting a more downward trend.
Join Our Telegram channel to stay up to date on breaking news coverage