Join Our Telegram channel to stay up to date on breaking news coverage
XRP Price Prediction– September 30
XRP/USD bulls have been trying to break the recent downtrend for quite some time but the price has been rejected from several critical resistance levels.
XRP/USD Market
Key Levels:
Resistance levels: $0.270, $0.280, $0.290
Support levels: $0.210, $0.200, $0.190

Looking at the daily chart, we can observe a clear downtrend for XRP/USD. The 9-day and 21-day moving averages have been acting as a robust resistance level even though the price has climbed above it several times. If the bulls want to see a shift in momentum, they will need to hold the price above the moving averages, convert both into support levels and continue trading upwards until they create a bull cross.
Where is XRP Price Going Next?
Ripple (XRP) is currently trading at $0.240 and any attempt below the 9-day and 21-day moving averages could open the door to drop further and the price could fall below the $0.210 support level. However, the traders need to keep an eye on the $0.245 and $0.250 before moving upwards while the resistance levels lie at $0.270, $0.280, and $0.290.
Moreover, the market may experience a quick-buy as soon as the trade reaches the $0.235 support. And if the price fails to rebound, then a bearish breakout is likely to trigger more selling opportunity for traders, which might cause the price to retest $0.210 and could further drop to $0.200 and $0.190 support levels respectively. The RSI (14) is moving below 48, XRP/USD may drop further.
Against Bitcoin, the situation is becoming bleak as the market trades above the 9-day MA at 2237 SAT. The XRP/BTC has not been able to break above this resistance level, causing a drop-down below the 21-day MA. The market opens today with a downtrend where it touches the daily low of 2228 SAT.
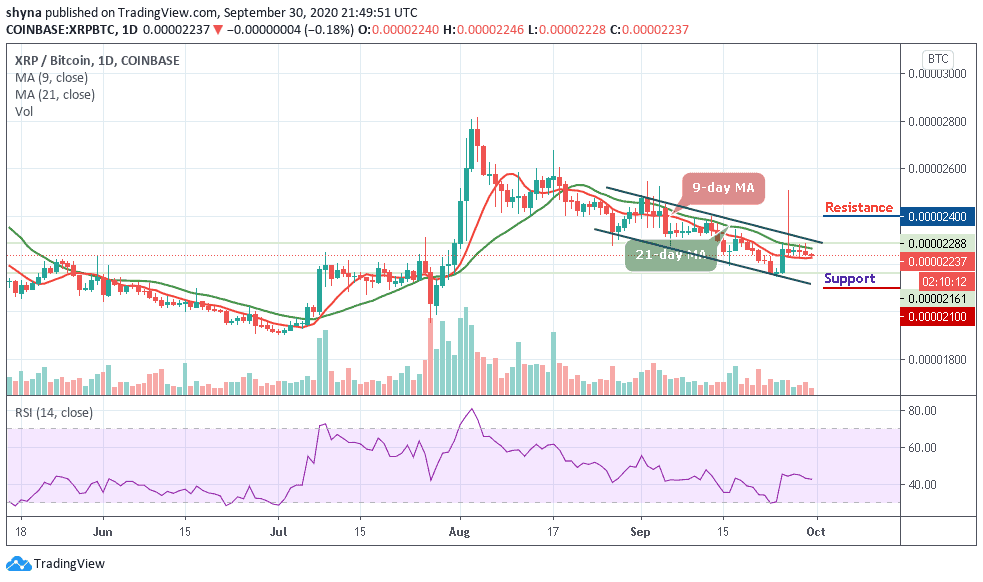
However, looking at the daily chart, the bears are stepping back into the market and may bring the price back below the 9-day moving average at the nearest support levels at 2100 SAT and below. Meanwhile, the RSI (14) may drop below 40-level, which indicates that the bearish movement may come to play.
Join Our Telegram channel to stay up to date on breaking news coverage