Join Our Telegram channel to stay up to date on breaking news coverage
XRP Price Prediction – September 25
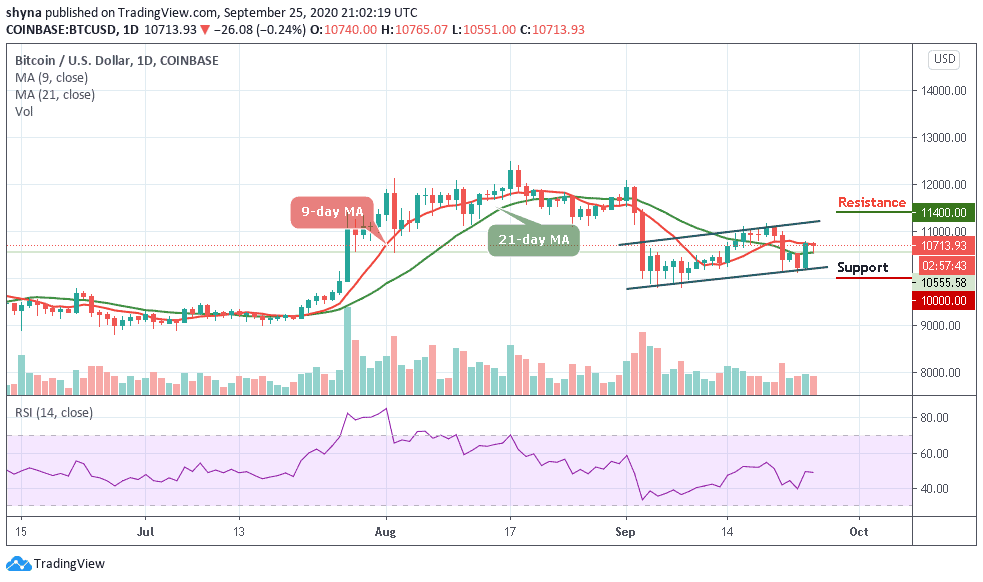
XRP/USD is currently having two straight bullish sessions as the market price moves above the moving averages.
XRP/USD Market
Key Levels:
Resistance levels: $0.270, $0.280, $0.290
Support levels: $0.210, $0.200, $0.190

At the time of writing, XRP/USD is trading at $0.3017 after holding above $0.24. A building bullish momentum suggests that XRP could continue to scale the levels towards $0.25 critical resistance. Meanwhile, XRP/USD bulls have stayed in control for two straight days as the price has gone up from $0.219 to $0.245 in the early hours of today.
Where is XRP Price Going Next?
From a technical point of view, the price is indeed in the hands of the bulls as observed using the technical indicator RSI (14), the signal line is pointing upwards after finding support at 32-level. The Ripple (XRP) is making it above the 9-day and 21-day moving averages and has the potential to hit levels above 50. However, as the RSI (14) rises to higher levels, the bullish grip may continue to strengthen.
For now, the nearest resistance for the market is located at $0.270, $0.280, and $0.290. As it appeared on the daily chart, there’s no sign of a decisive movement at the moment. However, if the $0.230 support gets weak, a price break-down may occur as the bears could create a new low at $0.210, $0.200, and $0.190 support levels.
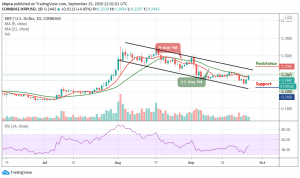
When compares with Bitcoin, the pair is consolidating within the channel and moving above the 9-day moving average. Meanwhile, the buyers have been trying to push the price above the 21-day moving average so as to take it to the resistance levels of 2400 SAT and above.
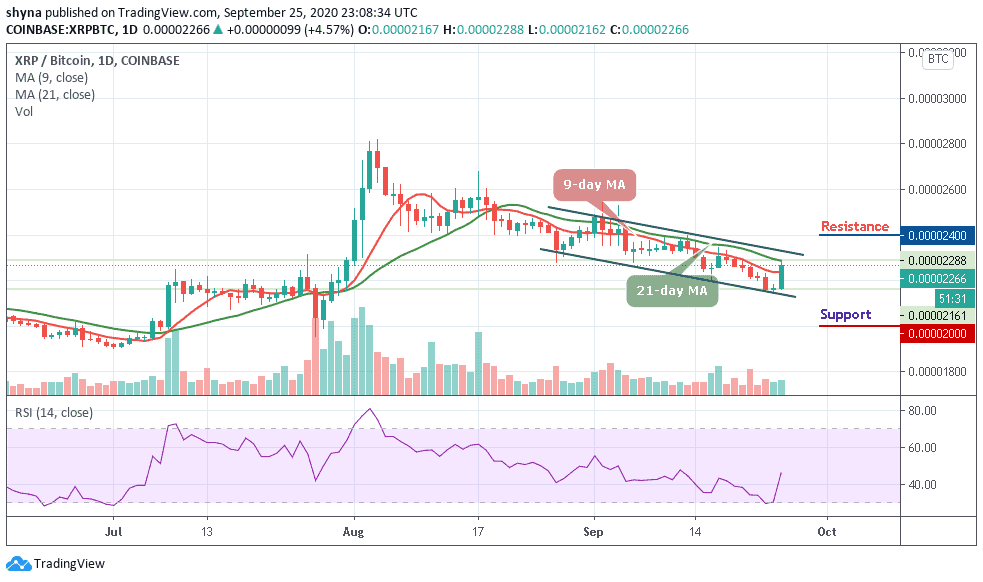
Looking at the daily chart, if the bulls failed to hold the price, then XRP/BTC may experience another downtrend and the nearest support levels for the coin are located at 2000 SAT and below. Meanwhile, the technical indicator RSI (14) is seen moving to cross above the 45-level, which indicates more bullish signals.
Join Our Telegram channel to stay up to date on breaking news coverage