Join Our Telegram channel to stay up to date on breaking news coverage
XRP Price Prediction – January 24
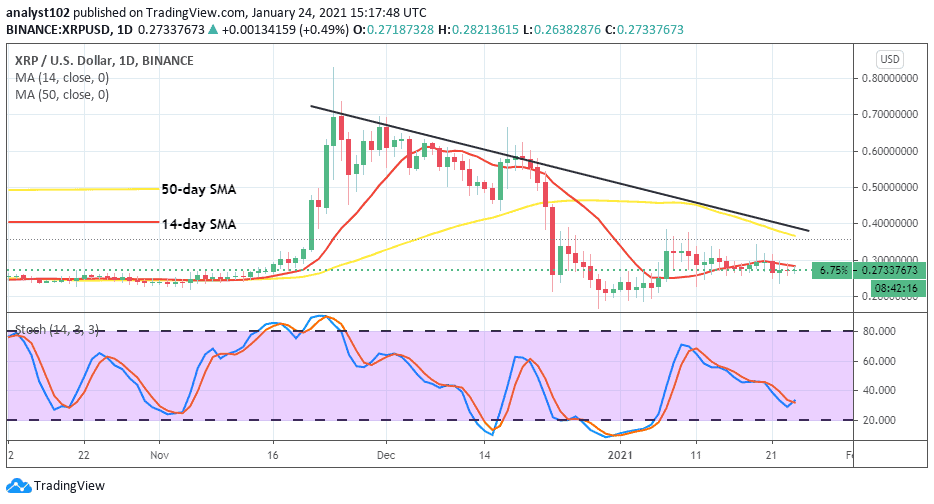
XRP/USD market has continued to keep featuring variant lower lows and lower highs between the values of $0.40 and $0.20 to have the $0.30 mark as the mid-range trading point until the present.
XRPUSD Market
Key Levels:
Resistance levels: $0.50, $0.60, $0.70
Support levels: $0.20, $0.15, $0.10
XRPUSD – Daily Chart
There have been two short-bullish candlesticks last year showing upswing-signals based on getting the crypto’s value in a recovery manner. However, the outcome has only led the market into struggling around the level of $0.30 until now. The 50-day SMA trend-line is a bit bent southward at $0.40 line, with the 14-day SMA trending along with price below it. They point to the east direction. That signifies a range-move ongoing currently in the XRP/USD trading operations. The Stochastic Oscillators have slantingly dipped southbound into the ranges between 40 and 20. They seem to attempt to cross the hairs northward, within the specified ranges. That could probably signify a gradual return of an upsurge price move.
What could be the XRP/USD’s next formation pattern?
Currently, XRP/USD market instrument appears to keep its sideway-moving mood as long as the price trades along with the smaller SMA trend-line around the $0.30 level. Meanwhile, bulls have to keep building from around the $020 lower range zone against most of the near short-falling forces averaging it. A sudden spike at a resistance of $0.40 value will be well enough to suggest a good resumption of a bullish trend.
Being as it is, bears may have to consistently push XRP/USD price southward if the crypto-market eventually attempts to test a critical trading point around the $0.40 mark in the next trading sessions. However, a further-downward push below the $0.20 lower range trading level may potentially bring about bears getting trapped afterward.
XRP/BTC Price Analysis
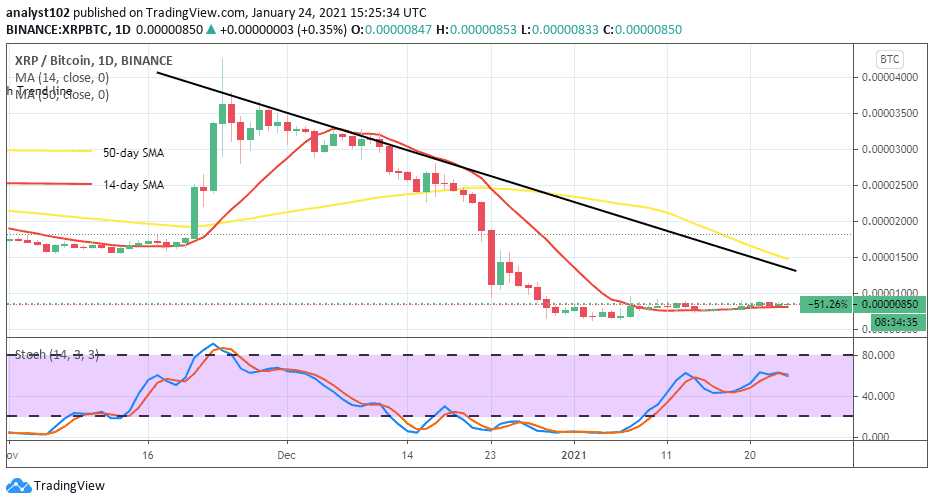
Comparing the weight-value of XRP with the BTC’s, the chief counter-crypto has outweighed its base cryptocurrency on a high note. The base instrument is now struggling to regain its feet against the heavy pressures impound on it over the last several weeks of trading sessions. The 50-day SMA trend-line is at B0.000015 level above the 14-day SMA pointing towards the south. The Stochastic Oscillators are now seemingly consolidating a bit below the range of 80. That suggests that an indecision-price move is still ongoing. Therefore, traders may have to wait for a decent price action before considering joining the market.
Join Our Telegram channel to stay up to date on breaking news coverage


