Join Our Telegram channel to stay up to date on breaking news coverage
XRP Price Prediction – May 19
The XRP/USD market points of around $1.60 and $1.40 have been witnessing some degrees of variant erratic price movements over time. As of the time of writing, the crypto’s value trades around the level of $1.46 with a -8.15% decreases.
XRPUSD Market
Key Levels:
Resistance levels: $1.60, $1.80, $2
Support levels: $1.25, $1.15, $1.05
XRP/USD – Daily Chart
The XRP/USD daily chart shows different amounts of higher lows. During yesterday’s session, the market surged higher to average the level of $1.80 before it began to lose momentum to downside pressure. The trend-line of the 14-day SMA has majorly involved in the up and down movements of the market as it still points in the north direction. The bullish trend-line drew below it over the 50-day SMA indicator. And, they all point towards the north also. The Stochastic Oscillators are in the ranges of 40 and 80 attempting to close the hairs. That signifies the possibility of the market holding down to lower points in the next more active price movements.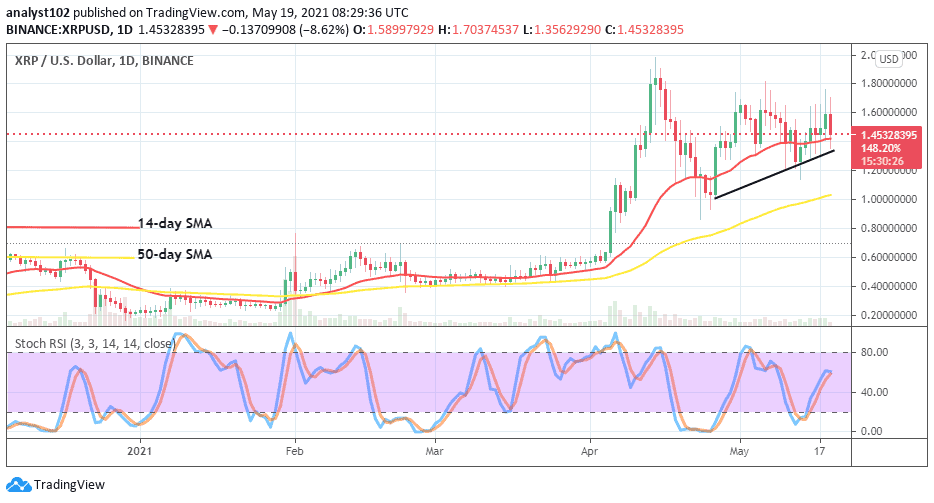
What next could happen to the XRP/USD price?
One definite market direction is expected to occur at the breaking of the $1.40 level either to the downside or to the upside in a bid to set up for higher profiteering moves. The XRP/USD market bulls may as well not be finding the breaking of the $1.60 smoothly if the current pace of energy discharged isn’t forcefully increased in a near session.
A well-formed bearish candlestick is needed against the trade levels of $1.40 and $1.30 to suggest the possibility of getting to see lower values in the XRP/USD market. However, traders need to exercise some degree of trades’ guiding principles while placing an order. In the meantime, a hold of the market value below the smaller SMA trend-line may lead price to revisit the support of $1 in no time.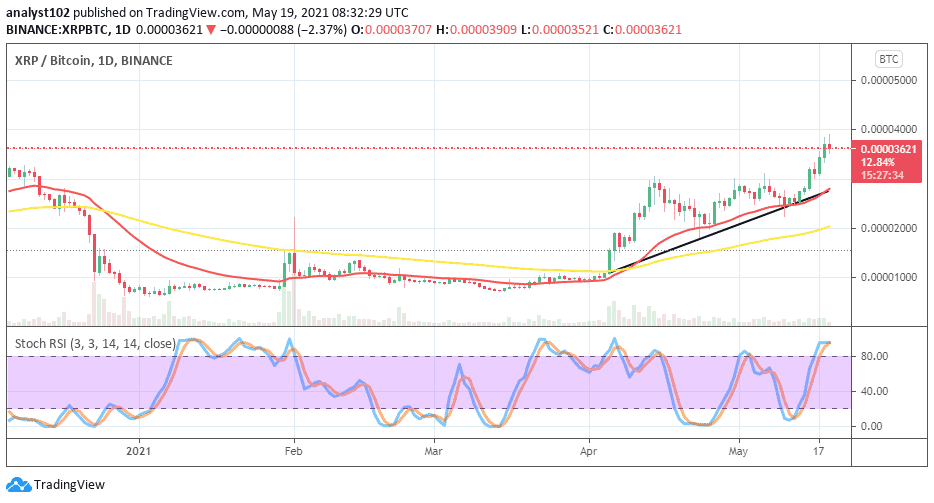
XRP/BTC Price Analysis
It is still indicated on the XRP/BTC chart that the base crypto is prevailing over the counter pairing instrument until now. Variant bullish candlesticks are being formed to the north to indicate that Ripple XRP is gaining a stronger buying stand in the crypto-economics space as compared with Bitcoin. The 50-day SMA indicator is situated underneath the 14-day SMA and the bullish trend-line. The Stochastic Oscillators are in the overbought region with an attempt to close the hairs within it. That could mean a sign of expecting a consolidation movement very soon. And, that may in the long run be in favor of getting to see more ups afterward.
Join Our Telegram channel to stay up to date on breaking news coverage