Join Our Telegram channel to stay up to date on breaking news coverage
XRP Price Prediction – October 8
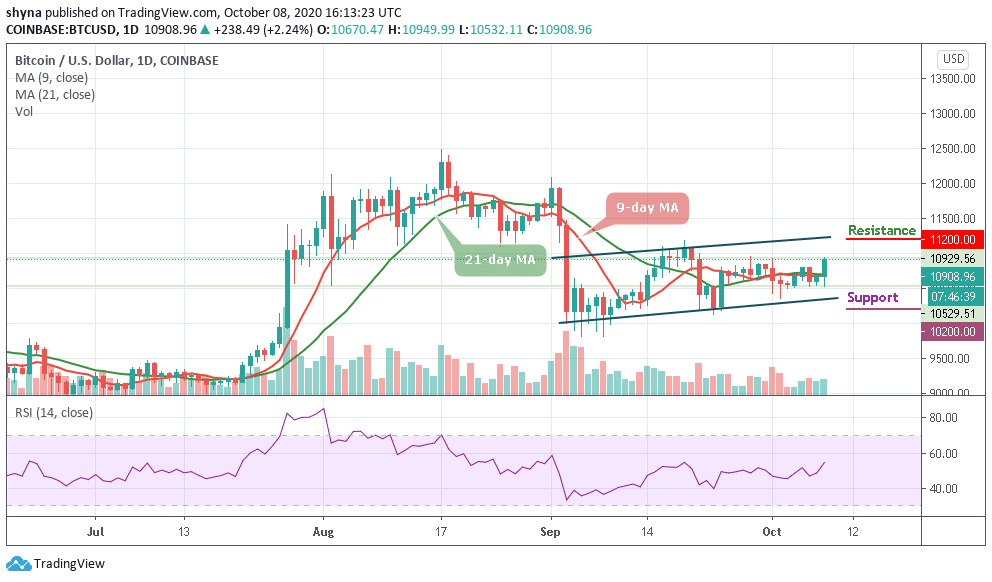
Ripple (XRP) continues to battle with the $0.25 level after being supported by the moving averages.
XRP/USD Market
Key Levels:
Resistance levels: $0.28, $0.29, $0.30
Support levels: $0.22, $0.21, $0.20

At the time of writing, XRP/USD is seen trading at $0.250. The cryptocurrency is doing very well at holding above the 9-day and 21-day moving averages. However, it continues to struggle to make additional movement across the upper boundary of the channel. More so, the attempt to break above the channel shows that the bulls are battling to be in control of the market momentum.
Would Ripple Go Up or Down?
From above, the nearest level of resistance lies at the $0.26 resistance level. Any additional movement above this may likely reach the important resistance level at $0.27. If the bulls can break above $0.276, higher resistance is located at $0.28, $0.29, and $0.30. Meanwhile, the nearest support lies at the $0.24 level. And the support in this area is further bolstered by both the 9-day and 21-day moving averages. Beneath $0.23, critical support lies at $0.22, $0.21, and $0.20.
Meanwhile, the technical indicator RSI (14) is currently moving around 55-level as traders wait for a more bullish crossover signal to push the market higher.
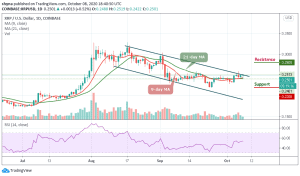
Against Bitcoin, it can be seen that XRP has been struggling to hold grounds above the 9-day and 21-day moving averages as it currently trades at around 2308 SAT. Mere looking at it from above, the nearest resistance level lies above the upper boundary of the channel. However, if the buyers push the Ripple (XRP) above 2335 SAT, the higher resistance level will be located at 2400 SAT, 2450 SAT, and 2500 SAT.
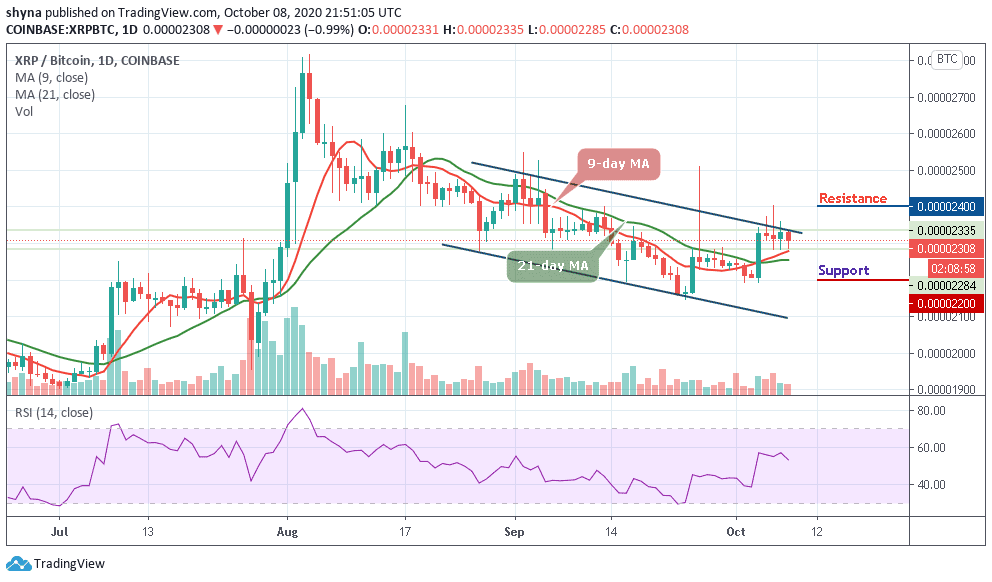
Moreover, the market price may likely cross below the red line of the 9-day MA to continue to give more bearish signals, if the downtrend movement continues and crosses below the 21-day MA, this can lead to more additional drops in the level of support close to 2200 SAT and below; where sellers are expected to dominate as the RSI (14) nosedives below the 55-level.
Join Our Telegram channel to stay up to date on breaking news coverage