

Join Our Telegram channel to stay up to date on breaking news coverage
XRP Price Analysis – November 28
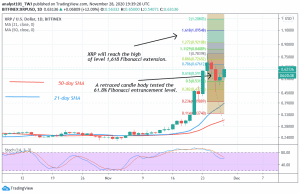
Ripple upward move reached a high of $0.78 resistance zone. On November 25, the coin has a breakdown as it dropped to $0.45 low. With a fresh uptrend, the market will reach a high of level 1.0954. Similarly; the XRP/BTC is in an upward move. The crypto has a target price of Ƀ0.000025660.
XRP/USD Market
Key Levels:
Resistance Levels: $0.24, $0.26, $0.28
Support Levels: $0.22, $0.20, $0.18

Ripple upward move was terminated at a high of $0.78. After testing the resistance zone thrice, XRP resumed a downward move. One of the reasons for the downward move is the overwhelming selling pressure above the resistance zone. On November 24, a candlestick indicated a long wick. The long wick indicates a strong selling pressure at a higher price level. Later, the coin slumped to the low above $0.45.
Similarly, the candlesticks on November 26 possess long tails. This indicates that there is buying pressure at a lower price level. With the buying pressure, the downtrend is likely to end. There is a tendency for the bulls to push XRP to retest the previous highs. On November 24 uptrend; a retraced candle body tested the 61.8% Fibonacci entrancement level. This implies that XRP will reach level 1.618 Fibonacci extensions or $1.0954 high.
Ripple (XRP) Indicator Analysis
The 21-day SMA and 50-day SMA are pointing northward indicating the uptrend. The coin is above the 60% range of the daily stochastic. It indicates that the coin is in a bullish momentum. The stochastic bands are making U-turn above the 60% range of the daily stochastic.
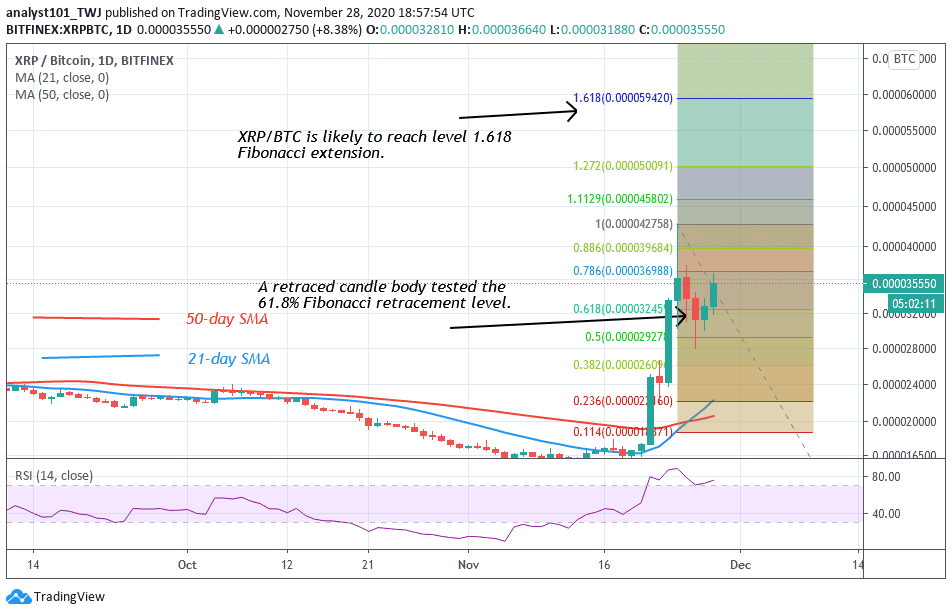
In the case of XRP/BTC, the crypto is an uptrend. The upward move has risen to level Ƀ0.000036988. The retraced candle body tested the 61.8 % Fibonacci retracement level. This indicates that the crypto will rise and reach level 1.618 Fibonacci extensions or the high of Ƀ0.000059420. Meanwhile, the coin is at level 75 of the Relative Strength period 14. This indicates that the coin is trading in the overbought region of the market.
Join Our Telegram channel to stay up to date on breaking news coverage
