Join Our Telegram channel to stay up to date on breaking news coverage
XRP Price Analysis – August 29
On August 27, Ripple dropped to $0.255 and resumed an upward. In the last 48 hours, the support has been holding as price reaches a high of $0.27. XRP/USD will resume upside momentum if the bulls push XRP above the EMAs or $0.28 support.
XRP/USD Market
Key Levels:
Resistance Levels: $0.24, $0.26, $0.28
Support Levels: $0.22, $0.20, $0.18
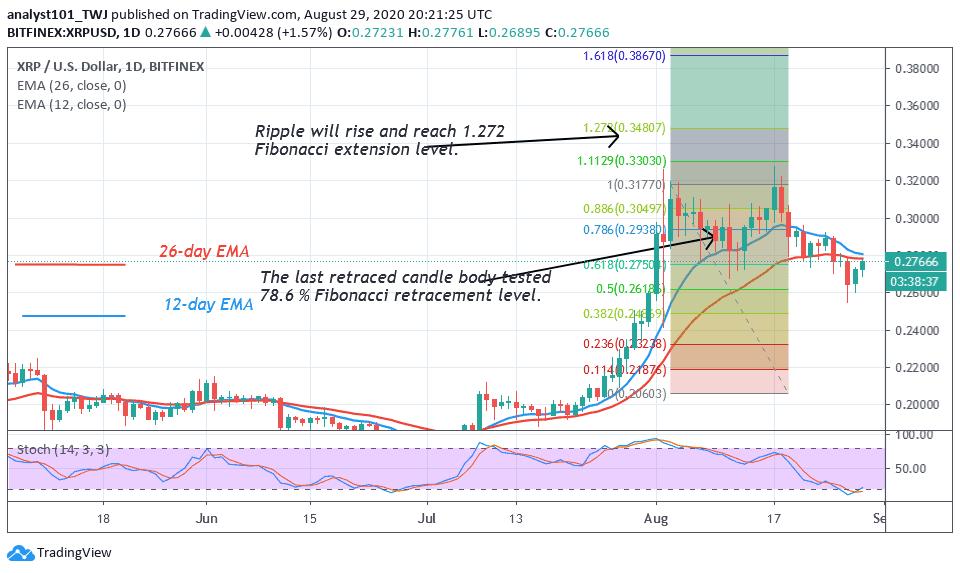
The $0.28 support has been a crucial support since August 1. The coin will resume upside momentum when price finds support above it. Today, the market has risen to $0.275 and it is approaching the $0.28 support. The market will retest the $0.32 resistance if buyers push above the $0.28 support. XRP will plunge to $0.24 low if bulls lose possession of the current price level of $0.27.
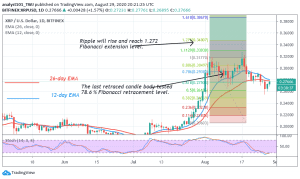
On August 3 uptrend, the XRP reached a high of $0.32 and was resisted. The retraced candle body tested the 78.6% Fibonacci retracement level. This indicates that Ripple will rise and reach the 1.272 Fibonacci extension level. That is the $0.36 high. At this level of 1.272, the market will reverse to 78.6 % Fibonacci retracement level where it originated.
Ripple (XRP) Indicator Analysis
Ripple has fallen below 20% range of the daily stochastic. Ripple has fallen into the oversold region of the market. This suggests that buyers are likely to emerge to push prices upward. Ripple is trading in the bearish trend zone as price is below the EMAs.
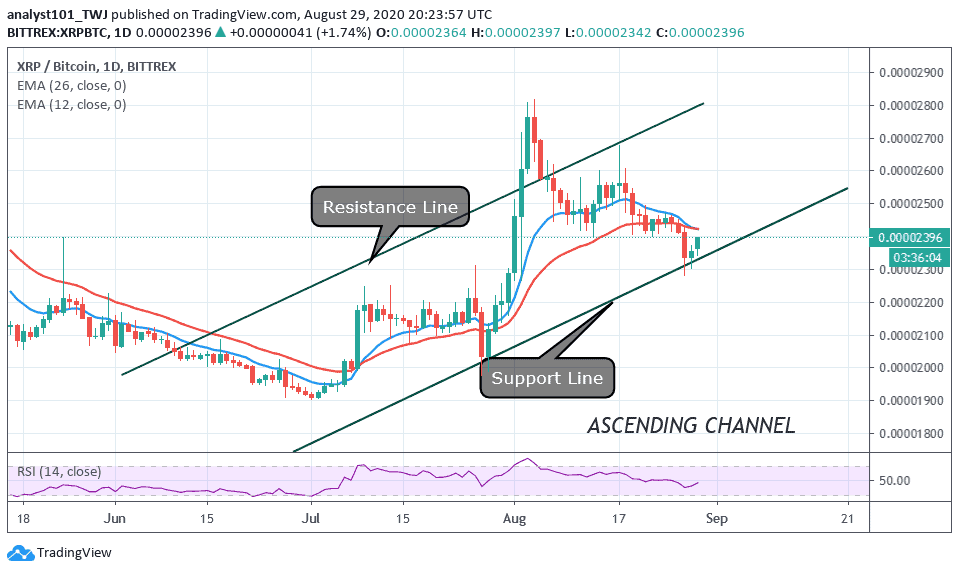
Similarly, on the XRP/BTC chart, the price is an uptrend. The coin is in ascending channel. The previous uptrend was terminated on August 3 at Ƀ0.00002800. The coin was in a downward move to the low of Ƀ0.00002280. Today, the coin is trading at Ƀ0.00002382 at the time of writing. The uptrend will resume when the coin is pushed above the 12-day EMA. The crypto is at level 45 of the Relative Strength Index period 14. It indicates that the coin in the downtrend zone.
Join Our Telegram channel to stay up to date on breaking news coverage