

Join Our Telegram channel to stay up to date on breaking news coverage
Bitcoin showed remarkable resilience during the recent crypto market downturn, staying relatively stable while many other cryptocurrencies experienced significant declines.
Despite prolonged corrections in most altcoins, Bitcoin maintained its position without major price movements, effectively holding crucial support levels.
Regulatory Clarity to Propel Bitcoin Adoption and Drive Mainstream Growth in the Crypto Industry
While regulatory clarity has always been a challenge for the cryptocurrency industry, the recent push for it has had a notable impact cryptocurrencies, causing most altcoins to dip in price in the past few weeks. However, Bitcoin’s experience has shown some bullish divergence. According to Santiment, despite a 10% price correction, Bitcoin whales have managed to accumulate approximately 60,000 BTC in the past few weeks. This suggests that regulatory clarity may actually be propelling Bitcoin adoption and driving mainstream growth in the crypto industry.
🐳 As #altcoin madness has ensued, there quietly is a #bullish divergence between #Bitcoin‘s accumulating whales and falling price. With whale holdings moving up by ~1K $BTC per day while prices fall, there is reason to believe a strong rebound can occur. https://t.co/Ol0cK5VhPE pic.twitter.com/FeHPqqJx7o
— Santiment (@santimentfeed) June 11, 2023
Moreover, in recent times, Bitcoin miners have been transferring significant amounts of coins to exchanges. This move could lead to increased selling pressure in the market and, eventually, a fall in price. There have also been significant outflows of multi-chain assets from exchanges like Binance and Coinbase, totaling billions of dollars.
According to Michael Saylor, the co-founder of MicroStrategy, a company that holds the most Bitcoins in the world, the adoption of Bitcoin is expected to increase as regulatory clarity stops confusion and suspense, particularly among institutional investors. This clarity will drive mainstream acceptance and further grow Bitcoin’s dominance within the cryptocurrency industry.
Regulatory clarity is going to drive #Bitcoin adoption by eliminating the confusion & anxiety that has been holding back institutional investors. Bitcoin dominance will continue to grow as the #Crypto industry rationalizes around $BTC and goes mainstream. pic.twitter.com/Foq4lpderj
— Michael Saylor⚡️ (@saylor) June 13, 2023
Besides, Bitcoin’s market dominance has neared 50% due to a recent market crash in altcoin prices triggered by strict actions from the SEC. This is the first time since April 2021 that Bitcoin’s dominance has reached this level.
Historically, when Bitcoin’s dominance surpasses 50%, it often indicates a bear market, as investors tend to move their funds to safer options. This was observed in 2018, when BTC dominance exceeded 50%. Bitcoin is expected to find support at around $25,000 while facing resistance near $26,100. Despite the SEC’s actions, long-term holders of Bitcoin continue to retain their assets.
Bitcoin’s Resilience Shines as Bulls Push for Recovery from $25,000 Bottom
Bitcoin has maintained above the $25,000 support level, and bulls are propelling a surge from this trough. However, can BTC rise from this bottom? The market is currently experiencing significant interest, and there is a strong demand that can withstand any considerable selling pressure.
However, the Estimated Leverage Ratio (ELR) has gradually increased during Bitcoin’s consolidation phase. The ELR is a metric that measures user leverage in derivatives trading, and higher values indicate a greater willingness to take risks. This increase in ELR aligns with the previously mentioned market interest.
According to CryptoQuant, an expert in the field, the decrease in market liquidity has not affected Bitcoin’s strength. The expert points to rising accumulation and active addresses as indicators of resilience.
Bitcoin Mirrors Certainty in Uncertain Marketshttps://t.co/CbzuInRDZP via @cryptoquant_com
— Timo Oinonen (@oinonen_t) June 11, 2023
Despite market makers selling a significant amount of cryptocurrencies associated with Binance, which adds selling pressure and reduces liquidity, Bitcoin’s technical and fundamental indicators demonstrate resilience in challenging market conditions. Bitcoin has managed to rise back above this threshold.
Sideways Consolidation and Potential Breakout Opportunity on 4-hour Chart
The Bitcoin price has been moving sideways, consolidating below $26,000. Consequently, BTC has formed a wedge pattern along the trendlines, suggesting a breakout opportunity may be approaching. This pattern indicates a continuation of the current trend, so the Bitcoin price may break above the upper trendline.
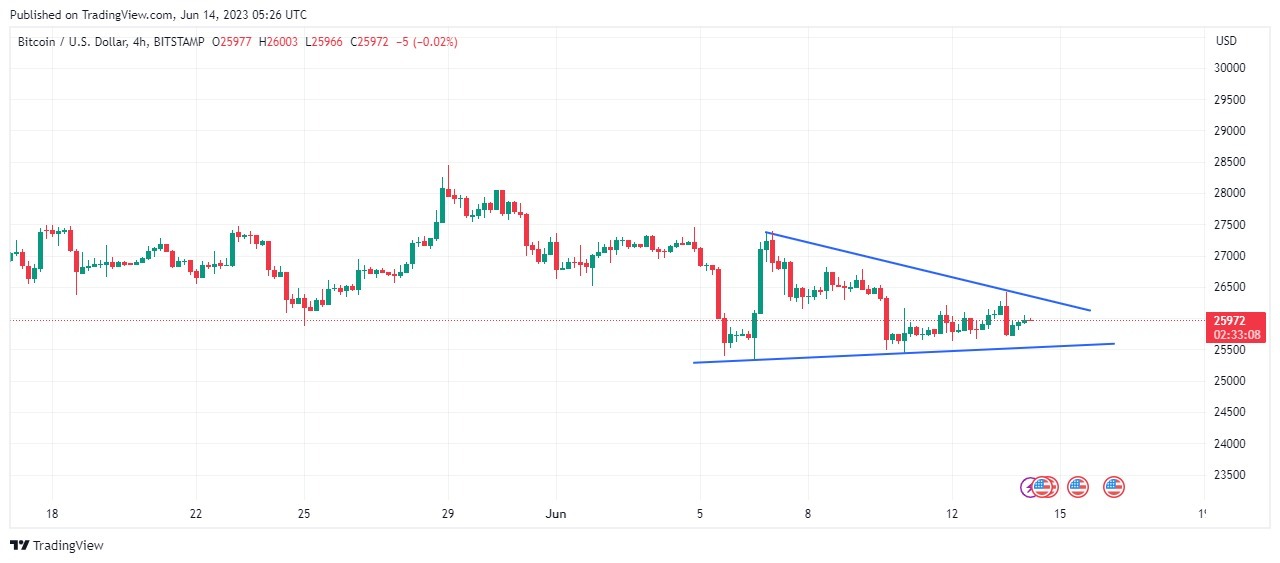
In the event of a breakout, it could lead to an increase in bullish momentum and present entry opportunities for traders. As a result, the Bitcoin price could rise to $30,000.
Regarding downside risk, the support trendline of the wedge pattern has been acting as a crucial level, preventing significant declines in the Bitcoin price. As long as this trendline remains intact, it is less likely for the price to drop below $25,000.
Bitcoin Price Analysis: Bullish Momentum Anticipated
At the time of writing, Bitcoin (BTC) is trading at $25,855.11, showing a slight decrease of 0.29% in the last 24 hours and a 3.31% decrease over the past week. With a circulating supply of 19 million BTC, Bitcoin holds a market cap of $503,947,246,754.
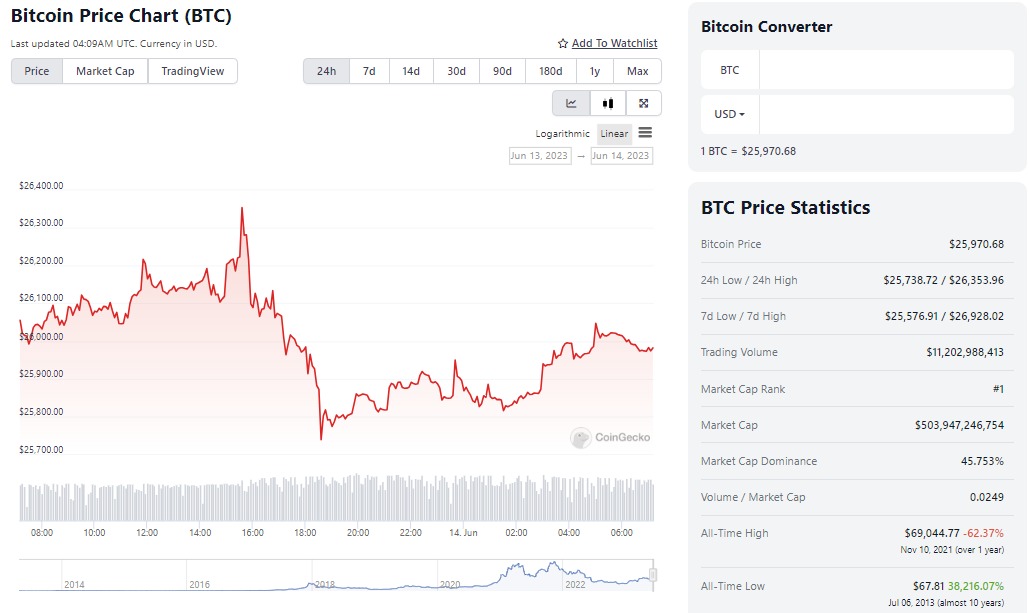
Additionally, the 24-hour trading volume of Bitcoin has reached $11,202,988,413, representing a 4.30% increase compared to the previous day and indicating a recent surge in trading activity.
Bitcoin’s highest recorded price is $69,044.77, which occurred in November 2021. However, the price is 62.37% lower than its all-time high at press time. Furthermore, the lowest price ever paid for Bitcoin was $67.81 in July 2013. Presently, the price is 38,216.07% higher than its all-time low.
Bitcoin Technical Price Analysis – Bitcoin Price Approaching 50 EMA
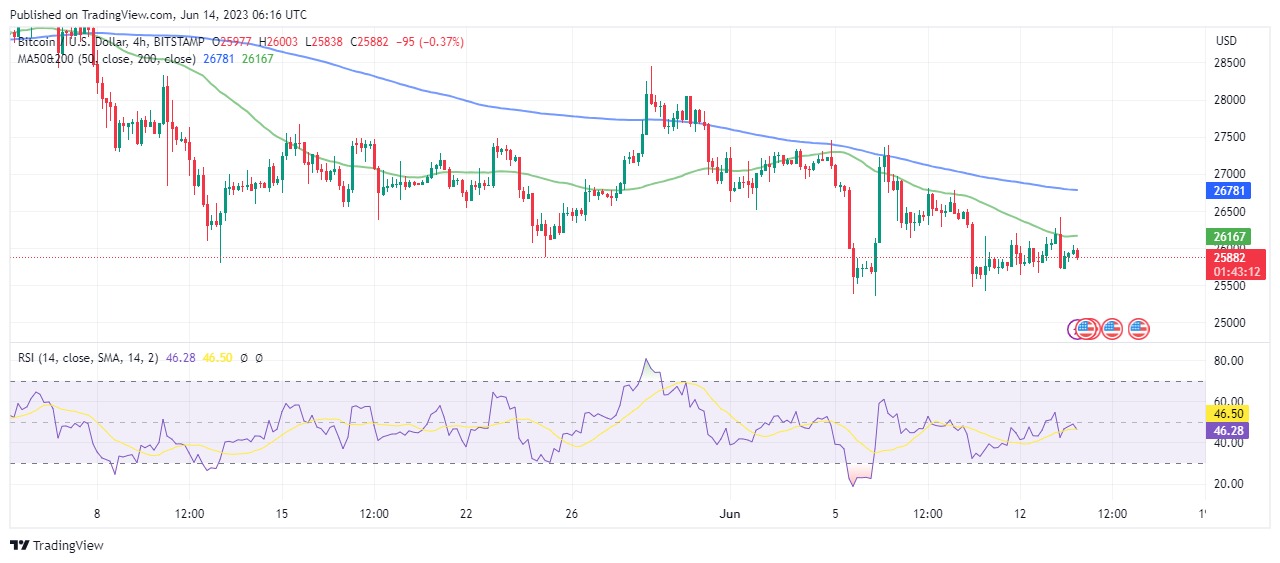
In the last six days, the price of Bitcoin has displayed short-bodied candles with long rejection wicks on both sides. These candles indicate a need for more clear dominance from buyers or sellers, creating uncertainty in the market. This suggests that cryptocurrency holders could experience significant volatility in the upcoming days.
The price of Bitcoin is also trading below the 50-day and 200-day moving averages, indicating that there is still more room for bulls to push the price up. However, the price is fast approaching the 50-day moving average, and should the price break above the MA, bulls will push the price up to the next resistance level.
The relative strength index is also moving swiftly toward the 50-level trading at 46. This shows that the bulls are determined to propel prices above the $25,000 bottom. Based on the analysis above and surrounding events around Bitcoin, we can forecast the price of Bitcoin surging in the short term to the $27000 resistance level.
Related News
- Bitcoin Analyst Forecasts Short-Term Recovery Amidst Strong Market Interest
- SEC Chairman Gary Gensler’s 2018 Video Contradicts Current Cryptocurrency Views
- Hinman Documents Unsealed! Ripple Price Surges Almost 10% With $1.8 billion Increase In Market Value
Best Wallet - Diversify Your Crypto Portfolio

- Easy to Use, Feature-Driven Crypto Wallet
- Get Early Access to Upcoming Token ICOs
- Multi-Chain, Multi-Wallet, Non-Custodial
- Now On App Store, Google Play
- Stake To Earn Native Token $BEST
- 250,000+ Monthly Active Users
Join Our Telegram channel to stay up to date on breaking news coverage