Join Our Telegram channel to stay up to date on breaking news coverage
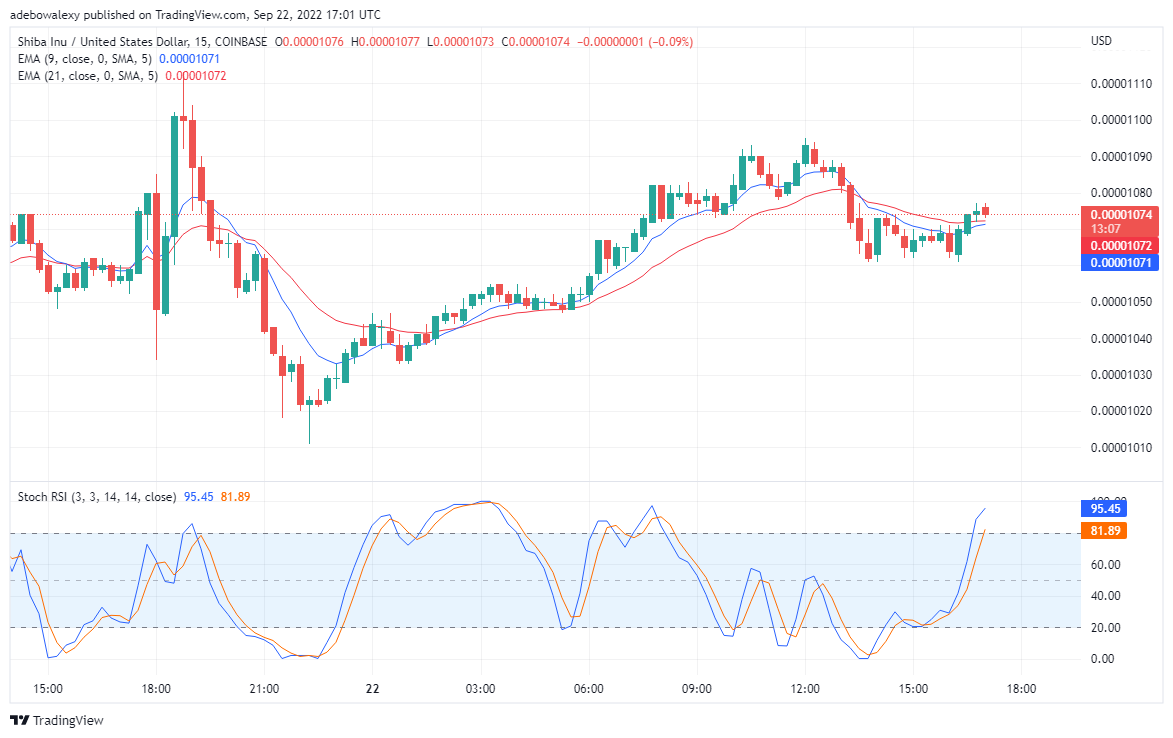
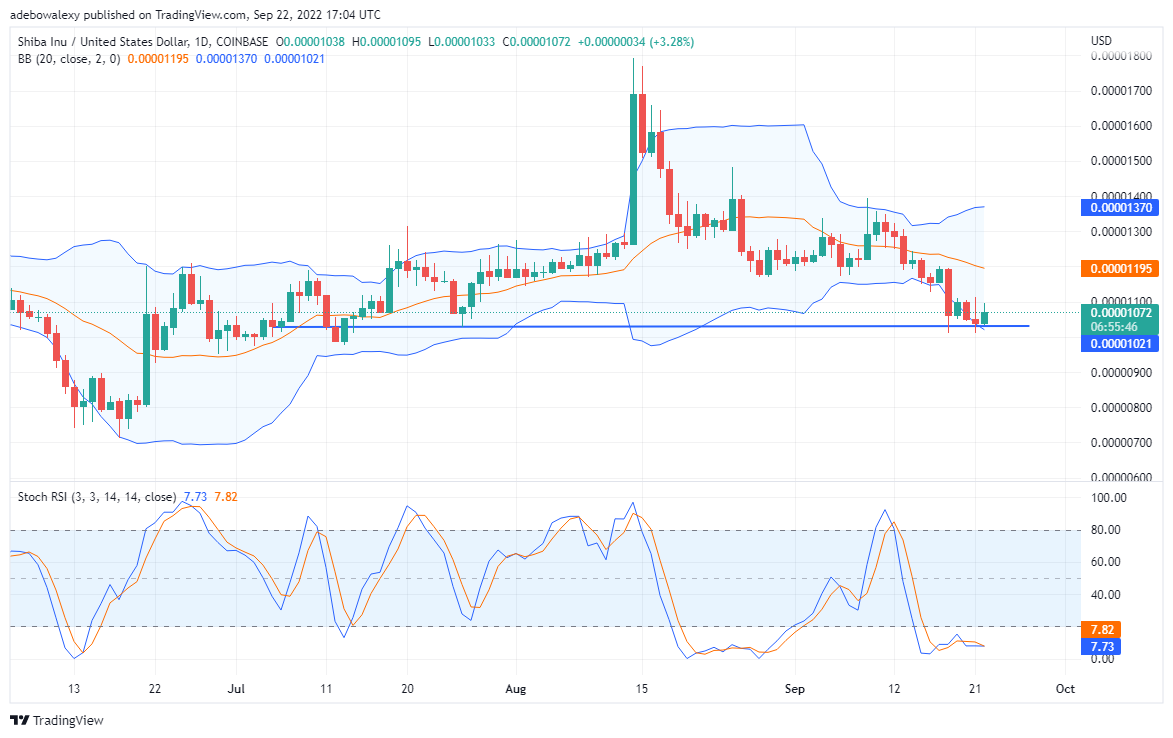
SHIB is attempting to reverse it’s current downtrend. However, this attempted reversal seems weak. This is portrayed on trading indicators and calls for closer examination.
Shiba Inu’s Forecast Statistics Data:
Shiba Inu’s current price: is $0.00001072
SHIB’s market cap: $5.94 billion
Shiba Inu’s circulating supply: 549.06 billion
Shiba Inu’s total supply: 589.74 trillion
SHIB’s Coinmarketcap ranking: #14
Major Value Marks:
Resistance: $0.00001072, $0.00001120, $0.00001175
Support: $0.000050, $0.00001020 $0.000010000
SHIB Is Attempting to Reverse Trend, TAMA Is Trending
Since around the 12th of this month, SHIB/USD daily Price movement keeps moving downwards towards lower supports. Also, there have been attempts by buyers to initiate a reversal, which eventually failed. Looking at the daily chart, it appears that price action has reached a strong support, which appears to have triggered some buy orders. Consequently, this has resulted in the formation of the last bullish candle. Furthermore, the Stochastic Indicator curves are crossing each other in the oversold. At this point, this will result in an uptrend. Therefore, traders can trap the upcoming trend, by placing a pending buy at around $0.00001110.
Price Analysis for Shiba Inu: Buyers Are Battling Hard in SHIB/USD Market
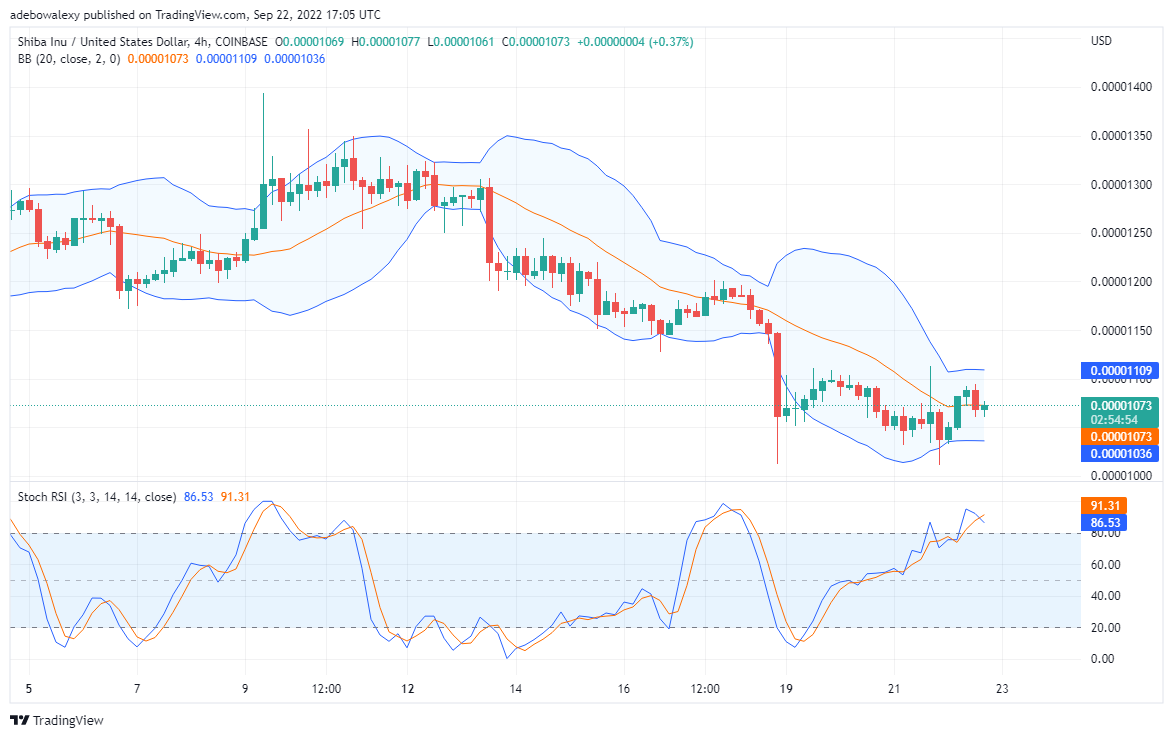
SHIB/USD four-hour chart reveals the tussle between buyers and sellers. However, it looks like buyers managed to stay on top in this fight. Furthermore, this has resulted into price getting to where it is. The last green candle on this chart managed to touch the MA of the Bollinger indicator which agrees with the possibility of further price increase.
Your capital is at risk
The RSI further portrays the struggle between bears and bulls. This is revealed in the irregular movement of its lines as it moves upwards. Although this market seems fragile, since the RSI has now reached significantly into the overbought, we may expect the price to move further upwards. Traders can anticipate the price level of $0.00001140 to be reached.
Tamadoge has also been highlighted by Bitcoinist, BeInCrypto, NewsBTC, and crypto influencers across social media. Jacob Crypto Bury above notes that a Tamadoge purchase equivalent to 55.8 ETH was recorded on Etherscan on Sunday.
Related
Join Our Telegram channel to stay up to date on breaking news coverage
