Join Our Telegram channel to stay up to date on breaking news coverage
At the opening of the market today, the VeChain (VET) price touches the daily high of $0.235 but currently following a bearish movement.
VeChain Prediction Statistics Data:
- VeChain price now – $0.0227
- VeChain market cap – $1.6 billion
- VeChain circulating supply – 72.5 billion
- VeChain total supply – 85.9 billion
- VeChain Coinmarketcap ranking – #34
VET/USD Market
Key Levels:
Resistance levels: $0.0280, $0.0300, $0.0320
Support levels: $0.0200, $0.0180, $0.0160
Your capital is at risk
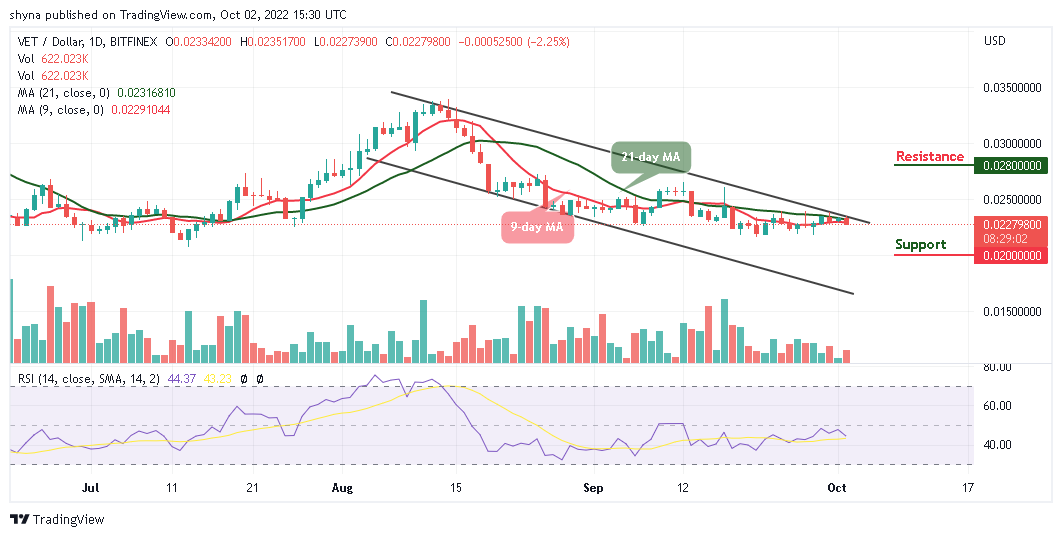
VET/USD is currently sliding below the 9-day and 21-day moving averages after several efforts to cross above the upper boundary. However, the crypto is trading in a downtrend after the bears took over from the bulls. Today, the VeChain price begins to drop after the opening trade of $0.0233, the coin is now slipping towards the support of $0.0220.
VeChain Price Prediction: Can VET Price Hit $0.0200 Support?
Looking at the daily chart, the VeChain price is been controlled by the bears as the technical indicator confirms the bearish movement. However, should the coin fails to rally from current trading levels, the traders may have a greater chance to see the cryptocurrency falling into the additional downsides. Moreover, a break below the $0.0220 support level may provoke a sharp decline toward the supports at $0.0200, $0.0180, and $0.0160.
On the other hand, a break above the upper boundary of the channel may propel VeChain to rise to the nearest resistance level of $0.0250; therefore, a further bullish movement could take the VeChain price to a high of $0.0280, $0.0300, and $0.0320 resistance levels. Meanwhile, the Relative Strength Index (14) nosedives below 50-level, which may likely cause the market to experience more downward trends.
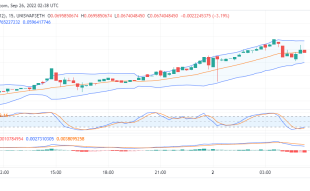
When compares with Bitcoin, the VeChain price continues to move sideways, as the coin recently touches the daily low at 119 SAT and continues to fall towards the 9-day and 21-day moving averages. Therefore, if the sellers increase the selling pressure, the critical support level could be located at 112 SAT and below.
However, any attempt by the bulls to re-power the market, the coin may likely cross above the upper boundary of the channel which could find the potential resistance level at 130 SAT and above. Meanwhile, the price of VeChain is currently changing hands at around 120 SAT and a spike in volatility could occur as the technical indicator Relative Strength Index (14) is ready to cross below the 50-level.
Join Our Telegram channel to stay up to date on breaking news coverage