Join Our Telegram channel to stay up to date on breaking news coverage
USDCAD Price Analysis – July 25
The price may likely reach the high supply level of $1.3207 in case the Bulls maintain or increase their momentum. Any interruption from the Bear may result in price consolidation at the level.
USD/CAD Market
Key levels:
Supply levels: $1.3207, $1.3367, $1.3493
Demand levels: $1.3023, $1.2930, $1.2783
USDCAD Long-term Trend: Bullish
USDCAD is bullish in the long-term outlook. The currency pair found support at the demand level of $1.3023 on July 12. The pair consolidated at the level for a week. At the beginning of last week, a strong bullish candle emerged and pushed up the price towards the dynamic resistance level of 21 periods EMA, the level was broken up and the price moved up towards the resistance level of $1.3207.
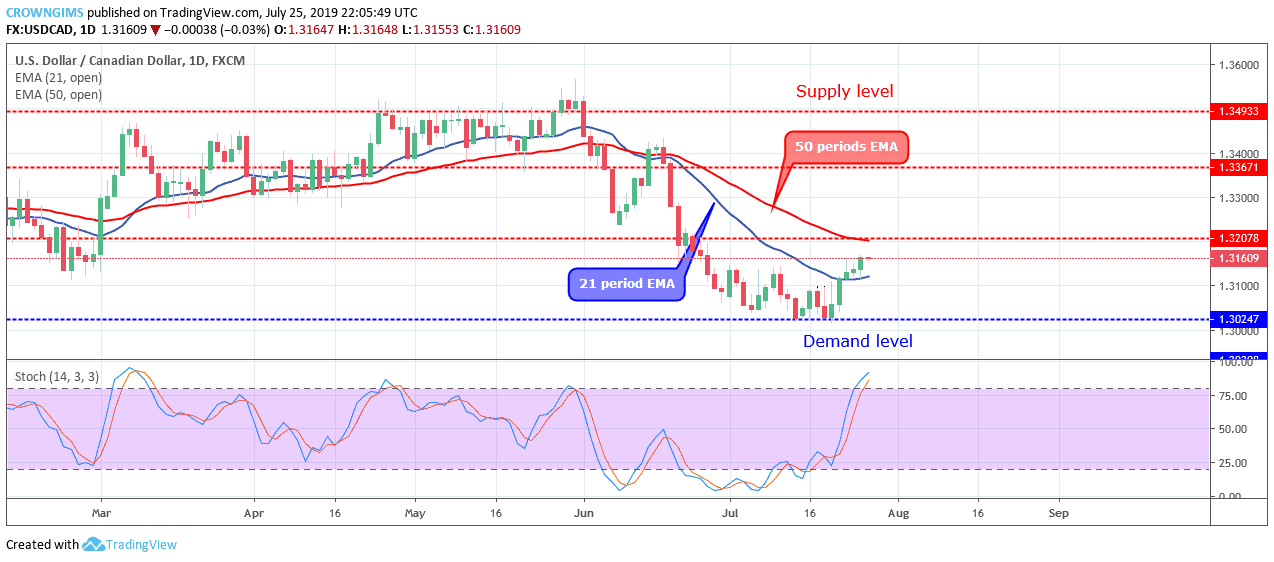
USDCAD has crossed over 21 periods EMA, moving towards 50 periods EMA; that means the price is trading in between the 21 periods EMA and 50 periods EMA which indicates that the bullish momentum is increasing. The Stochastic Oscillator period 14 is above 75 levels and the signal lines pointing up to indicate a strong buy signal.
The price may likely reach the high supply level of $1.3207 in case the Bulls maintain or increase their momentum. Any interruption from the Bear may result in price consolidation at the level.
USDCAD medium-term Trend: Bullish
USDCAD is bullish in the medium-term outlook. Last week on the 4-hour chart, the currency was consolidating at the demand level of $1.3024. On July 19, the Bulls break up the two EMAs and the price rallied towards the supply level $1.3207 but not yet reach the mark.
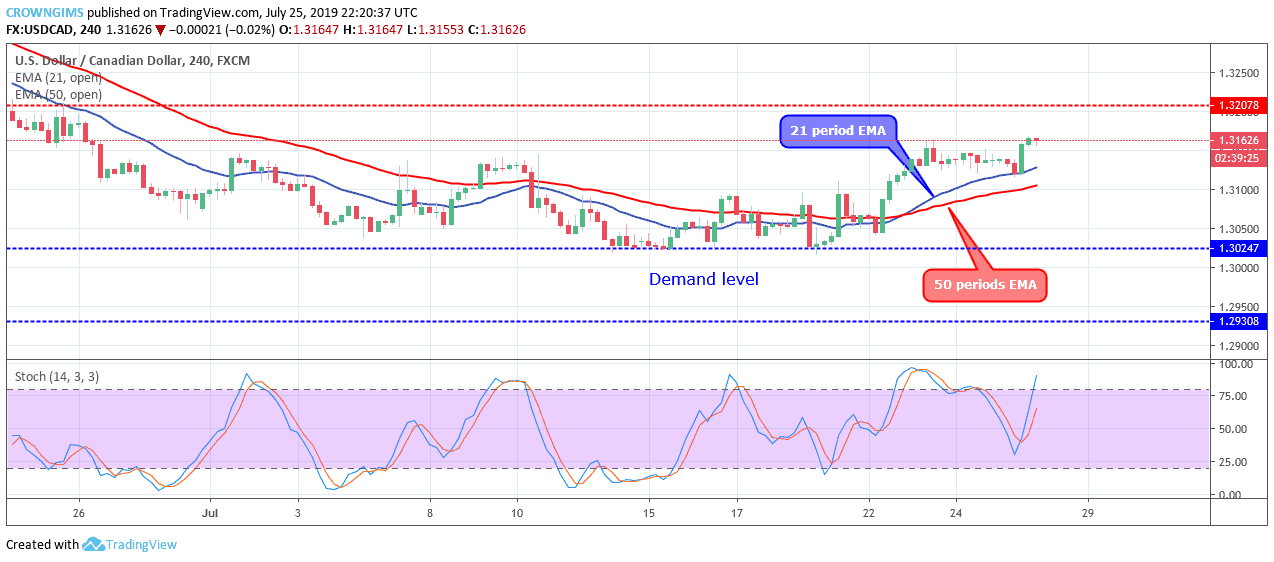
USDCAD is currently trading above the 21 periods EMA and 50 periods EMA which connotes strong bullish momentum in the 4-hour chart. The Stochastic Oscillator period 14 is at 60 levels and the signal lines pointing up to indicate a buy signal.
Please note: insidebitcoins.com is not a financial advisor. Do your own research before investing your funds in any financial asset or presented product or event. We are not responsible for your investing results.
Join Our Telegram channel to stay up to date on breaking news coverage