


Join Our Telegram channel to stay up to date on breaking news coverage
USDCAD Price Analysis – June 06
The Bears have to increase their momentum, before the market can experience a bearish trend towards $1.3207, provided $1.3330 level does not hold.
USD/CAD Market
Key levels:
Supply levels: $1.3493, $1.3648, $1.3845
Demand levels: $1.3367, $1.3207, $1.3111
USDCAD Long-term trend: Ranging
USDCAD is on the ranging movement on the long-term outlook. The currency pair has been ranging within the supply level of $1.3493 and the demand level of $1.3367 for many days. On May 29, there was a fake breakout at $1.3493 by the Bulls in which the price was pushed up but the bullish momentum could not carry it far. On June 03, a strong massive bearish candle emerged and pushed the price down below the $1.3493 level.
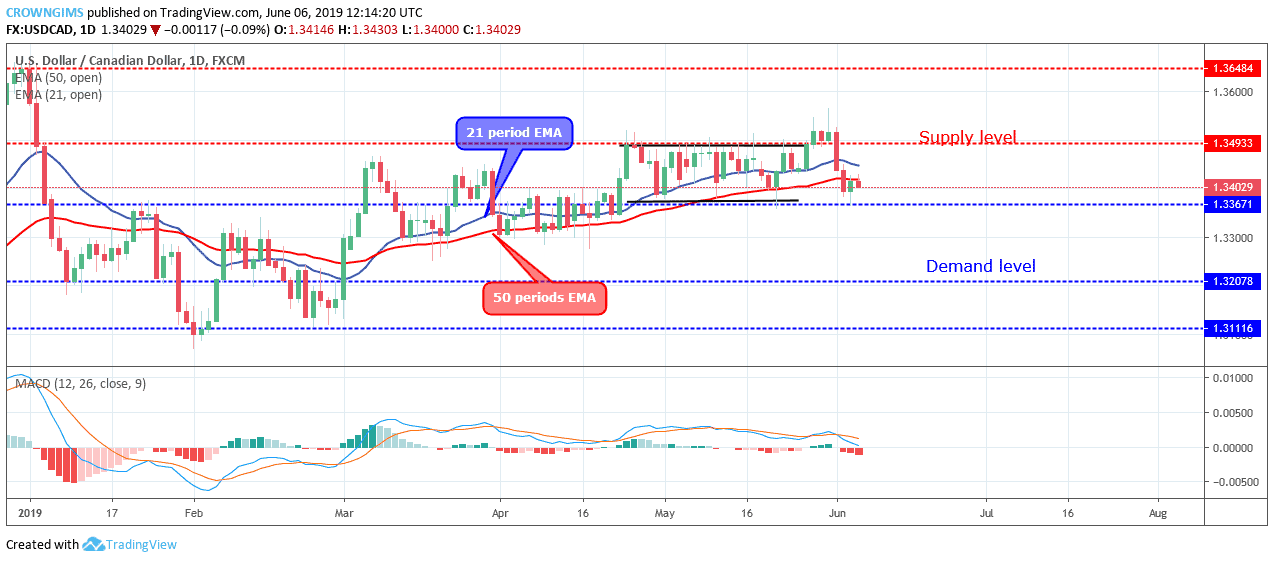
The currency pair has been trading over and around the 21 periods EMA and 50 periods EMA in which the two EMAs are horizontally flat within the range level without any specific direction; this confirms the ongoing ranging movement in the market of USDCAD. However, the Moving Average Convergence Divergence period 12 with its histogram is below zero levels and the signal lines pointing down to indicate sell signal.
The Bears have to increase their momentum, before the market can experience a bearish trend towards $1.3207, provided $1.3367 level does not hold.
USDCAD medium-term Trend: Bearish
USDCAD is bearish in the medium-term outlook. The Bulls broke out of the consolidation phase at the supply level of $1.3493. On May 29, the price retested the broken level after which it moved towards the $1.3648 level. On May 31, a long-tailed inverted pin bar formed which triggered the bearish momentum and the price rolled down towards $1.3367. The price bounced at the level after the formation of the bullish engulfing candle.
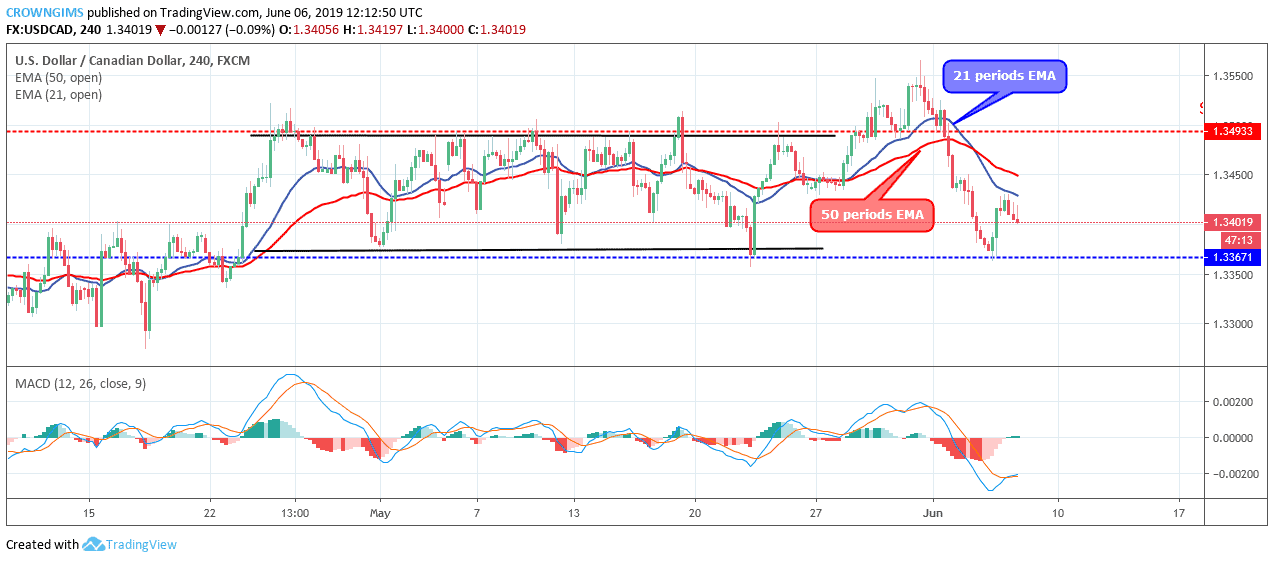
The pair is trading below the 21 periods EMA and the 50 periods EMA. The MACD period 12 with its histogram is above zero levels and the signal lines pointing up to indicate a buy signal.
Please note: insidebitcoins.com is not a financial advisor. Do your own research before investing your funds in any financial asset or presented product or event. We are not responsible for your investing results.
Join Our Telegram channel to stay up to date on breaking news coverage
