
Join Our Telegram channel to stay up to date on breaking news coverage
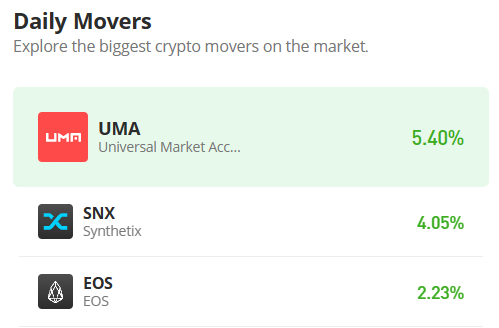
The Universal Market Access price prediction shows UMA could renew the bullish trend after testing the support level of $2.0 today.
Universal Market Access Prediction Statistics Data:
- Universal Market Access price now – $2.16
- Universal Market Access market cap – $150 million
- Universal Market Access circulating supply – 68.9 million
- Universal Market Access total supply – 108.8 million
- Universal Market Access Coinmarketcap ranking – #186
UMA/USD Market
Key Levels:
Resistance levels: $2.80, $3.00, $3.20
Support levels: $1.70, $1.50, $1.30
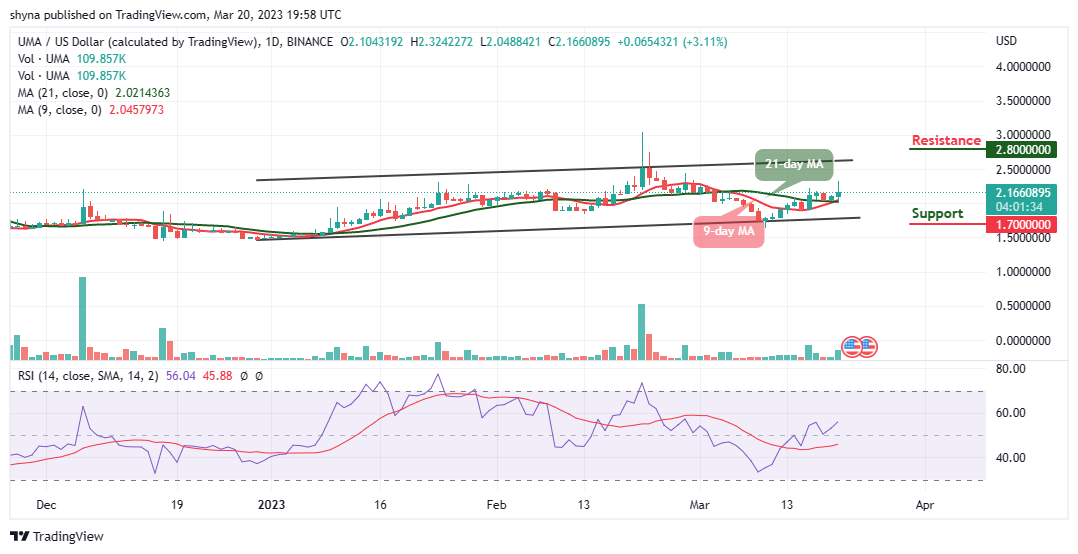
UMA/USD regains ground after touching the daily low at $2.04 during the European session today. The Universal Market Access price is currently changing hands at $2.16 and despite the recovery, the coin is still hovering above the 9-day and 21-day moving averages.
Universal Market Access Price Prediction: Would UMA Price Move to the Upside?
According to the daily chart, the Universal Market Access price is moving towards the resistance level of $2.50 as the initial move to cross the upper boundary of the channel could boost the price further up. The Universal Market Access (UMA) hits the daily high at $2.32 before retreating to where it is currently trading. Looking at it from above, more bullish movements may come into play if the Universal Market Access price stays above the moving averages as the nearest resistance level could be found at $2.50.
However, traders can see that the daily movement remains in the hands of the bulls, and the technical indicator Relative Strength Index (14) remains above the 50-level, building on the consistent recovery from the downside. Meanwhile, a break above the $2.50 level may most likely push the coin toward the potential resistance levels of $2.80, $3.00, and $3.20 while a drop toward the lower boundary of the channel may lead to the supports of $1.70, $1.50, and $1.30 respectively.
Against Bitcoin, the Universal Market Access price is seen moving bearishly below the 9-day and 21-day moving averages. After the coin touches the daily high at 839 SAT today, the coin later retreated to the low of 729 SAT. Meanwhile, the price keeps facing the south, but the buyers may need to step back into the market.
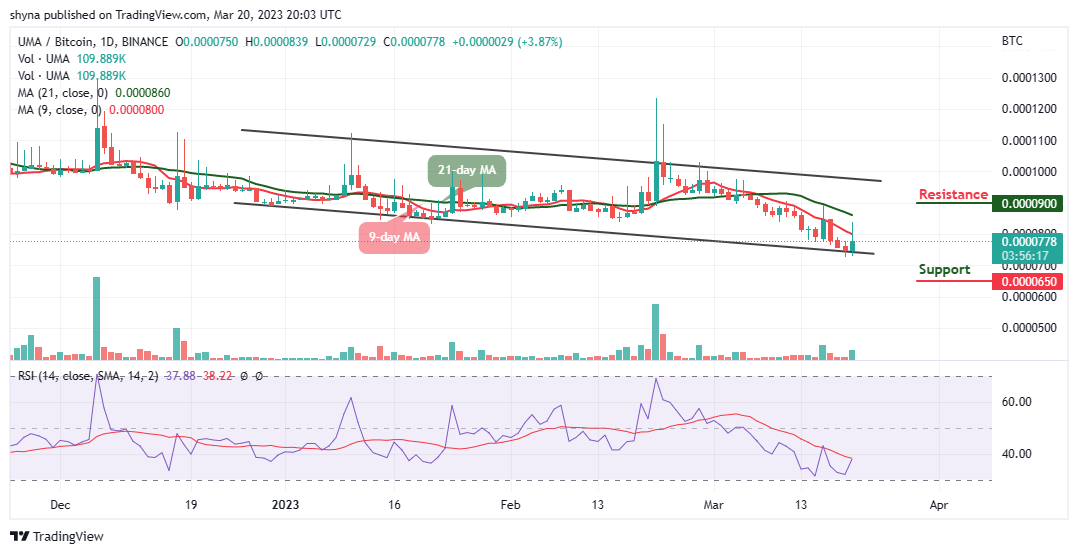
Moreover, should the sellers return to the market, the Universal Market Access price may drop to the support of 650 SAT and below. At the moment, the technical indicator Relative Strength Index (14) moves to cross above the 40-level as the market could face upward movement to hit the resistance level at 900 SAT and above.
Alternatives to Universal Market Access
The UMA price retreats after touching the daily high of $2.32 as a result of selling pressure in the market. The sellers are likely to step back into the market, but if the UMA price can break significantly above the $2.50 level, the bulls could take control of the market. Meanwhile, Love Hate Inu distinguishes itself from other meme coins due to its versatile accurate survey and poll results powered by the Ethereum blockchain – giving it a real-life utility beneficial to the global industry, the presale is still on as it has raised close to $2m in the presale.
Join Our Telegram channel to stay up to date on breaking news coverage