Join Our Telegram channel to stay up to date on breaking news coverage
TRXUSD Price Analysis – September 01
Tronix price broke down the support zone of $0.017 and heading towards the demand level of $0.011, the price may bounce at the demand level of $0.011 and reverse.
TRXUSD Markets
Key Levels:
Resistance Zones: $0.017, $0.021, $0.027
Support Zones: $0.011, $0.006, $0.001
TRX/USD Long-term Trend: Bearish
On the long-term outlook, Tronix is bearish. The bearish pressure that forces the price to drop to the support zone of $0.021 from the resistance level of $0.036 is still in operation in the TRXUSD market. The price consolidated at the $0.021 price level. On August 08, the price broke down the level and it declined to the former demand level of $0.017. The price repeated consolidation at the just mentioned level and it continues as at the time of written this report.
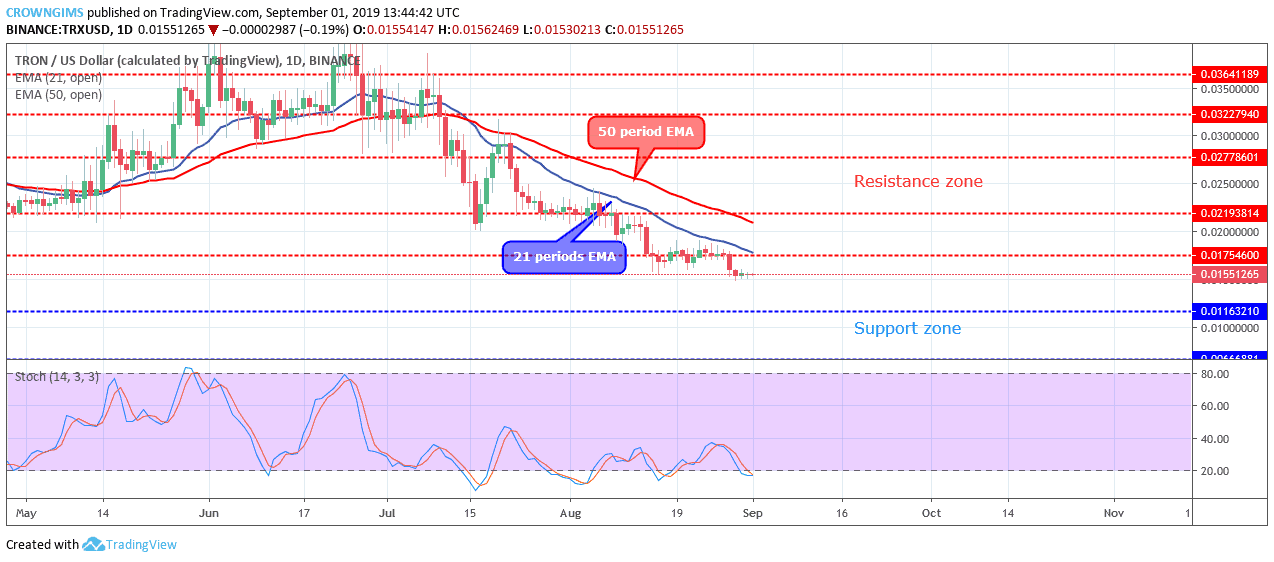
The 21 periods EMA retain its position below the 50 periods EMA in which the price continues to trade below the two EMAs which indicates a continuation of bearish momentum in the Tronix market. The Stochastic Oscillator period 14 is below 20 levels with the signal lines bending down which indicate a sell signal. Tronix price broke down the support zone of $0.017 and heading towards the demand level of $0.011, the price may bounce at the demand level of $0.011 and reverse.
TRX/USD Short-term Trend: Ranging
ETHUSD price is ranging on the medium-term outlook. The Bears lost the momentum after the bearish movement that took place on August 28. The bulls also have no enough momentum to propel the coin towards the north. Then, the cryptocurrency started consolidating.
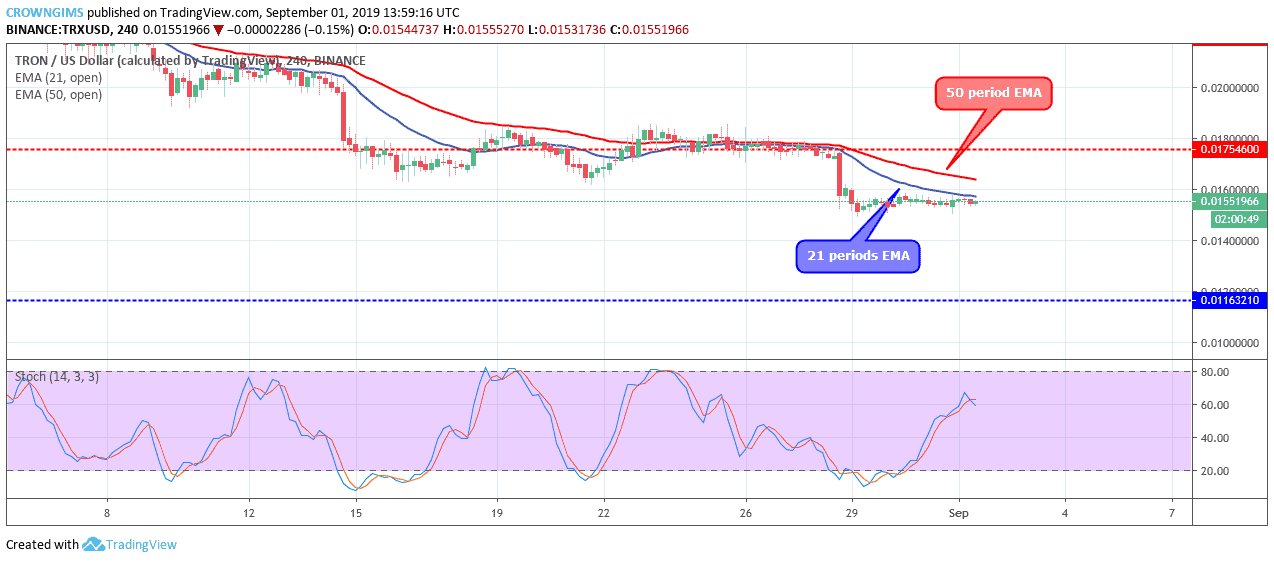
Tronix is consolidating below the 21 periods EMA and 50 periods EMA. The Stochastic Oscillator period 14 is at 60 levels and the signal lines bending down to indicates sell signal and a further reduction in TRXUSD price.
Please note: insidebitcoins.com is not a financial advisor. Do your research before investing your funds in any financial asset or presented product or event. We are not responsible for your investing results
Join Our Telegram channel to stay up to date on breaking news coverage