Join Our Telegram channel to stay up to date on breaking news coverage
TRON (TRX) Price Prediction – June 1
It has been the TRX trade activity faces a resistance again at $0.09. Barely a month ago, the crypto economy rose in its valuation as it is doing now at around $0.088 at a positive percentage rate of 5.03.
TRON (TRX) Price Statistics:
TRX price now – $0.08829
TRX market cap – $8.3 billion
TRX circulating supply – 93.7 billion
TRX total supply – 93.7 billion
Coinmarketcap ranking – #13
TRX/USD Market
Key Levels:
Resistance levels: $0.09, $0.10, $0.11
Support levels: $0.075, $0.065, $0.055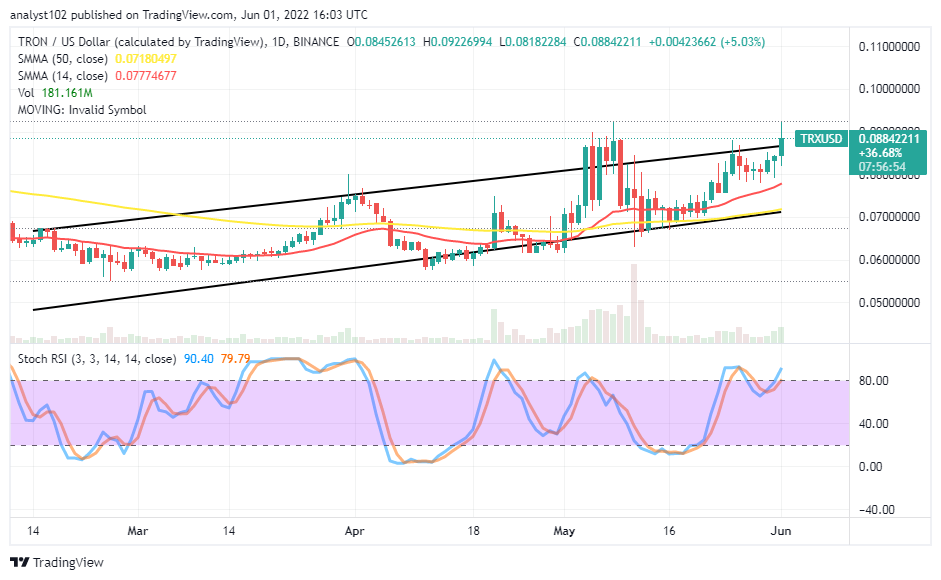 TRX/USD – Daily Chart
The daily chart shows the TRX market faces a resistance again at $0.09, as it had witnessed during the early last month’s trading sessions. The scenario may repeat itself as the 9th day’s trading candlestick turned bearish to mark the beginning of a correction thereof. The 50-day SMA indicator is at the lower bearish trend line drawn underneath the 14-day SMA indicator. A bullish candlestick has emerged to touch an area of the previous resistant-trading zone. The Stochastic Oscillators have moved southbound briefly at an initial stage from the overbought region to get across back to the northbound into the region. They are pointing toward the north side.
Will the TRX/USD market go down the same it did during the last month’s operations?
Technically inclined, the TRX/USD market operations to go down from its current trading zone as happened last month, especially while buyers tend to catch out some of their profits accumulated on the positions opened at lower support-trading zones. Observantly, the crypto-economic price faces a resistance again at $0.09. That signals a warning against the launching of new buying position orders.
On the downside of the technical analysis, the TRX/USD trade activities are on the path to making another trial of breaking resistance around the $0.09 line. However, bulls will have to put lots of effort at that value line to break above it. In the process of the price witnessing a slow-down in forces to the upside, sellers may have the advantage to launch back their presence again from around the high-resistant trading zone afterward.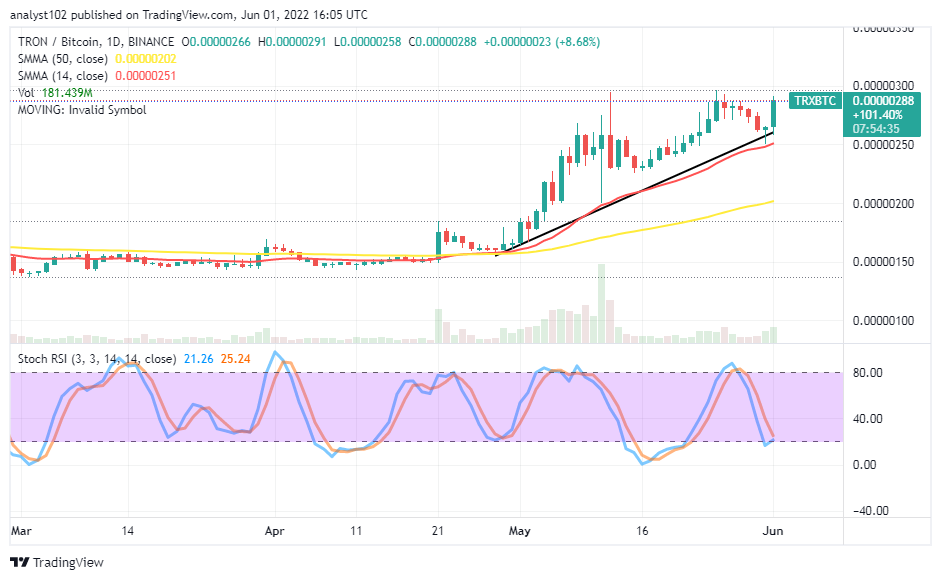
TRX/BTC Price Analysis
In comparison, TRX, as the base crypto, has been pushing northward against the trending capacity of BTC. The cryptocurrency pair price faces a resistance above the trend lines of the SMAs. The bullish trend line drew alongside the 14-day SMA trading indicator above the 50-day SMA indicator. And there is a space separating them apart to signify the intensity of the buying forces currently. The Stochastic Oscillators have crossed southbound from the 80 range to the range of 20. And they now try to close back around it. A bullish candlestick is in the making to depict the base crypto’s trending capacity still dominates the trading operations at the expense of the counter crypto’s weakness.
Read more:
Join Our Telegram channel to stay up to date on breaking news coverage