

Join Our Telegram channel to stay up to date on breaking news coverage
The crypto market recovery started in early January with improvements in the macro environment such as reducing inflation rates, which provided the required tailwinds for the upward move. The Threshold price has risen to levels last seen in May 2022. The T price is up 181% year-to-date from the opening value of $0.0167.
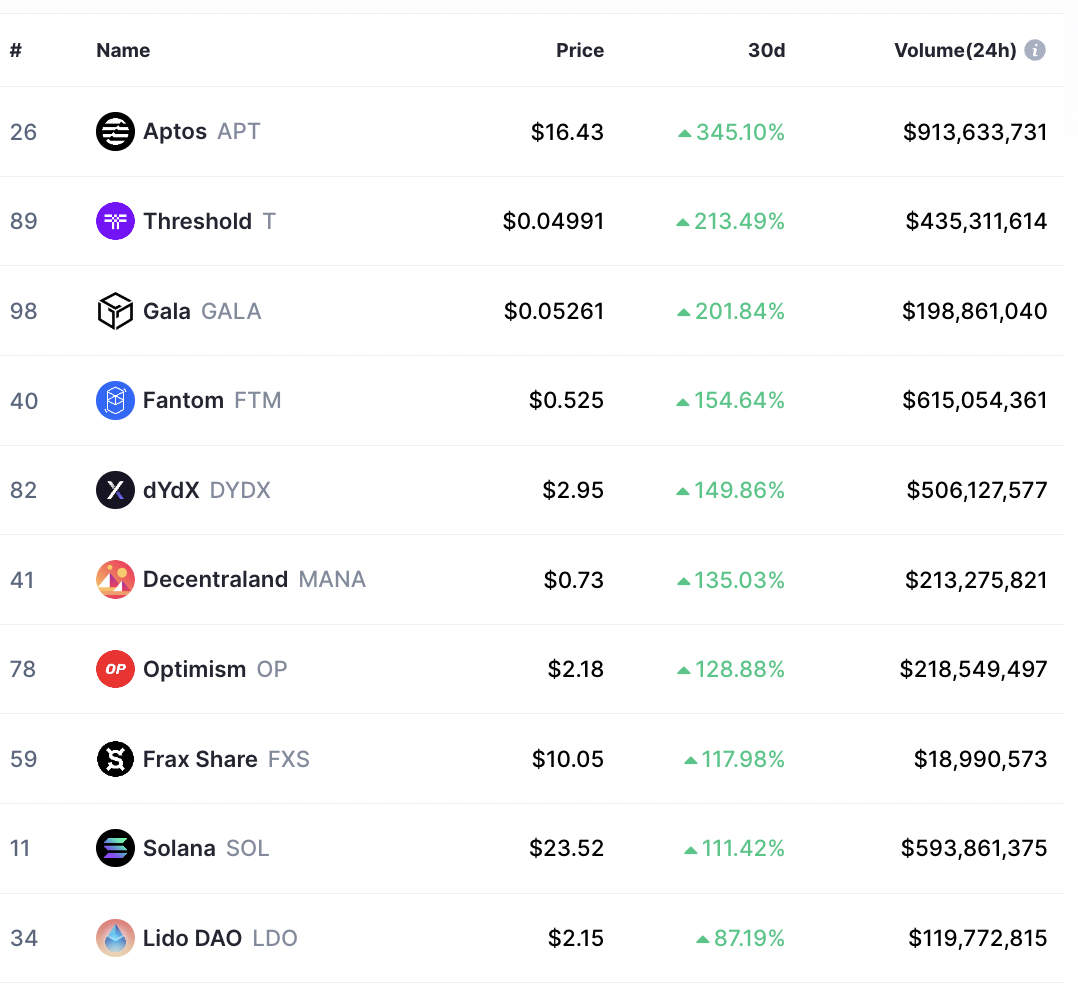
This rally has placed Threshold Network’s native token T among the best-performing coins over the last 30 days. According to data from CoinMarketCap, T was the second-best-performing cryptocurrency in January after rising 213.5% over the month. Threshold (T) was behind Aptos (APT) which was up 345% in the past 30 days and ahead of Gala (GALA) which had gained 201.84% in one month. Fantom (FTM) and dYdX (DYDX) closed the top five list after rallying 154.64% and 150% respectively, over the same time frame.
Top 10 Crypto Gainers In January
It was expected that the growth in crypto prices would be crippled even more in 2023, particularly after the FTX/SBF/Alameda research debacle. The lack of bullish outlooks for the crypto space is believed to be the reason behind the short squeeze posted by the top-cap cryptocurrencies.
The largest cryptocurrency by market value Bitcoin (BTC) is up 37% over the last month with the second-placed Ethereum (ETH) rising 29%. Cardano (ADA) posted better gains climbing 50% in January. The Elon Musk-backed meme coin Dogecoin (DOGE) is up 28% in the last 30 days.
However, there are still macro headwinds to look out for. For example, the ongoing FTX-SBF lawsuit, potential Digital Currency Group (DGC) fallout, burgeoning bankruptcy filings, recession risks due to aggressive quantitative tightening (QT) policies by the Fed, and the extended geopolitical tension between Russia and Ukraine are expected to underpin crypto prices this year.
Nevertheless, the crowded positions and negative sentiments in futures are expected to drive the upside. There is a high possibility of a pullback soon after the recent gains. Let’s take a look at how the Threshold price may move in the near term.
Threshold Price Bulls May Exploit A Bullish Flag
The T/USD pair was sealed in a tight range between $0.01481 and $0.02262 for months before escaping from the consolidation on January 23. What ensued was a 200% rally to highs above $0.068. The price has since turned down from the higher levels recording a number of lower highs and lower lows to the current price of $0.04966.
This price action has led to the appearance of a bullish flag on the daily chart (see below). This is a significantly bullish technical formation that is confirmed when the price closes above the upper boundary of the flag, signaling the continuation of the uptrend. This sets the asset up for an upward move which is equal to the sharp rise made from the consolidation zone to the local high (forming the flag’s post) just before the price corrected.
In Threshold’s case, a daily candlestick close above the flag’s resistance line at $0.04893 would confirm a bullish breakout. Increased demand pressure from there could see the token rise 158% from the current price to reach the technical target of the governing chart pattern at $0.126.
T/USD Daily Chart
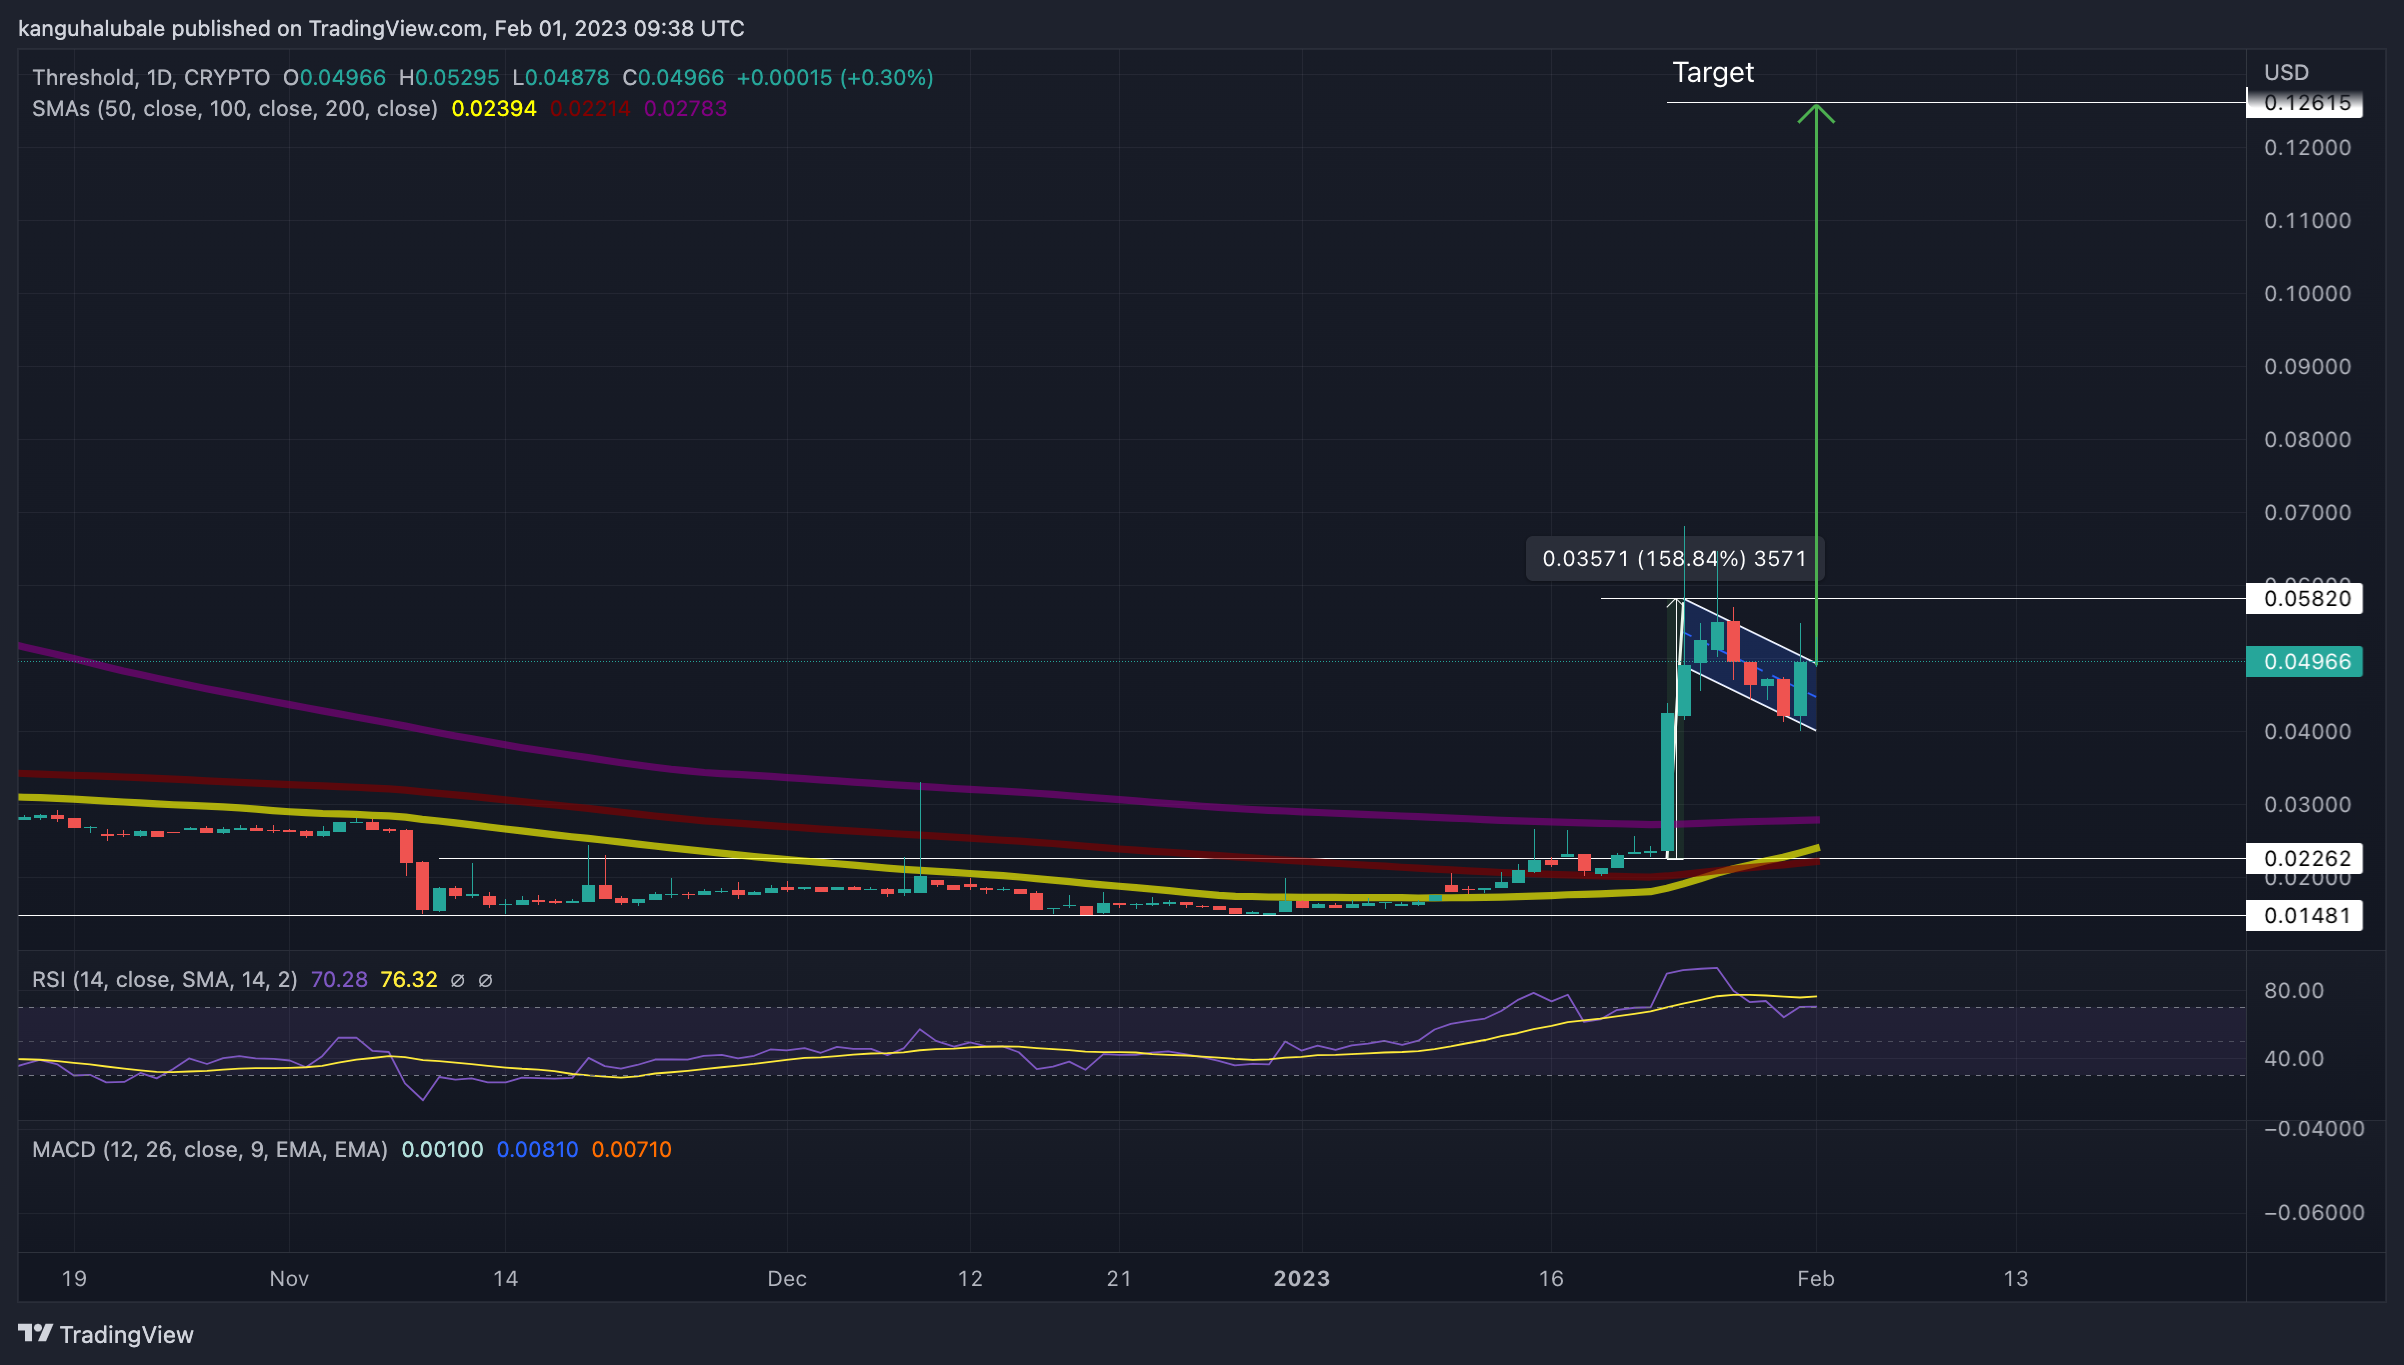
Apart from the bullish technical setup, the moving averages and the relative strength index (RSI) were tipping upward, a sign that the uptrend was strong. The price strength at 70 reinforced the bulls’ grip on the T price, adding credence to the bullish narrative.
In addition, the moving averages had just sent a bullish signal. Though not a ‘golden cross’, when the 50-day SMA crossed above the 100-day SMA on January 27, it signified that the market favored the buyers.
On the downside, the RSI painted near overbought conditions, implying that the buyers may soon run out of steam. As fatigue sets in, the sellers are likely to take over, occasioning a correction.
As such, a daily candlestick close below the flag’s support line at $0.04 would trigger massive sell orders that could see the T price drop to tag the 200-day SMA at $0.02783. Other levels to watch on the downside, are the 50-day SMA at 0.02394 and the $0.02262 support zone, where the 100-day SMA currently sits.
A move lower would take the Threshold price back into the consolidation zone. Traders could expect the price to take a breather here, giving a chance to late investors to get in on the dip before making another attempt at recovery.
Related News:
- Dogecoin Price Analysis: DOGE is Bullish Catalyzed by Elon Musk’s Twitter Plans
- Silvergate Knew More About FTX Woes Than It Is Saying, US Senators Say
- Best Crypto to Buy Now
- How to Buy Bitcoin
Best Wallet - Diversify Your Crypto Portfolio

- Easy to Use, Feature-Driven Crypto Wallet
- Get Early Access to Upcoming Token ICOs
- Multi-Chain, Multi-Wallet, Non-Custodial
- Now On App Store, Google Play
- Stake To Earn Native Token $BEST
- 250,000+ Monthly Active Users
Join Our Telegram channel to stay up to date on breaking news coverage