
Join Our Telegram channel to stay up to date on breaking news coverage
The Graph (GRT) Price Prediction – September 12
The graph market is trying to make a recovery, trading against the valuation of the US Dollar. The last ninety days of trading sessions have witnessed a high of $0.1569 and a low of $0.08576. Price is currently around $0.1186 at an average rate of 1.63%.
The Graph (GRT) Price Statistics:
GRT price now – $0.1186
GRT market cap -$818.4 million
GRT circulating supply – 6.9 billion
GRT total supply – 10 billion
Coinmarketcap ranking – #57
GRT/USD Market
Key Levels:
Resistance levels: $0.15, $0.175, $0.20
Support levels: $0.095, $0.085, $0.075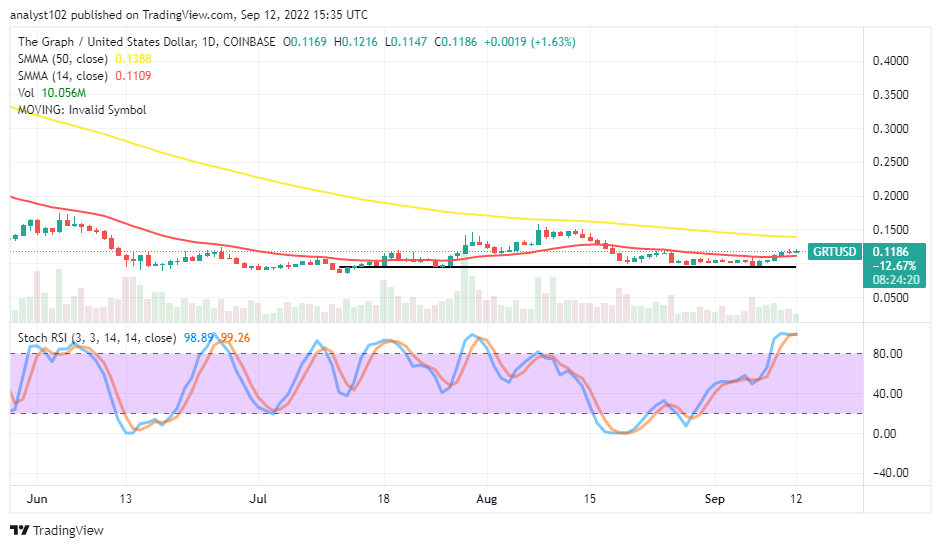 GRT/USD – Daily Chart
The daily chart reveals the GRT/USD market is trying to make a recovery as it has pushed slightly past the smaller SMA trend line to the upside. The 14-day SMA indicator is at $0.1109, underneath the $0.1388 value line of the 50-day SMA indicator. The horizontal line drew at the $0.095 support level. The Stochastic Oscillators have moved into the overbought region to reach the 98.89 and 99.26 range points.
Your capital is at risk.
Can there be more sustainable ups in the GRT/USD market soon?
The GRT/USD market has been pushing to a notable extreme point that upward moves won’t be on for a long time, even though the crypto economy is trying to recover. In the wake of striving to surge northward more from the current trading point, the buying signal side of the 14-day SMA trend line needs not breach southward suitably to not cause a panic sell-off. Investors have to hold their positions on a long-term running basis.
On the downside of the technical, going by the reading of the Stochastic Oscillators, the situation suggests there will be a resumption of a downward motion in no time. A sudden pull-up any moment from now could in no time turn into a losing time of momentum to the downside. The majorly resisting-trading line lies around the value point of the 50-day SMA, around $0.1388. Bears may regain market control down to the support baseline at $0.10 in the long run.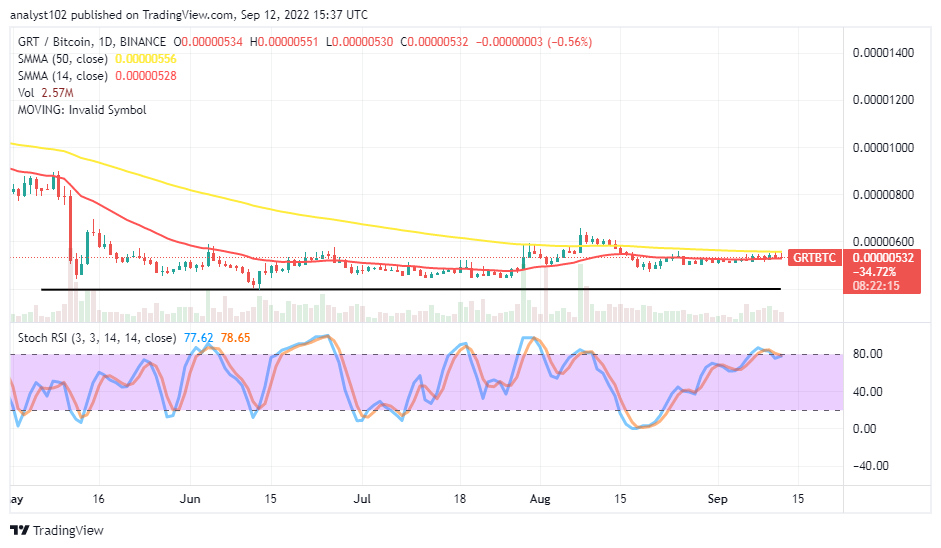
GRT/BTC Price Analysis
The Graph trade activity appears to push gradually to the maximal trading point against Bitcoin. And the cryptocurrency pair market may soon stop trying to drag further to the north side against the bigger-SMA trend line. The 50-day SMA indicator is closely over the 14-day SMA indicator trend line of the 14-day SMA. The Stochastic Oscillators have somewhat conjoined in a consolidation mode to reach the range values of 77.62 and 78.65. That signifies the base crypto is on the verge of losing its stance to the counter-trading crypto.
Read more:
- How to buy The Graph
- How to buy cryptocurrency
Join Our Telegram channel to stay up to date on breaking news coverage