
Join Our Telegram channel to stay up to date on breaking news coverage
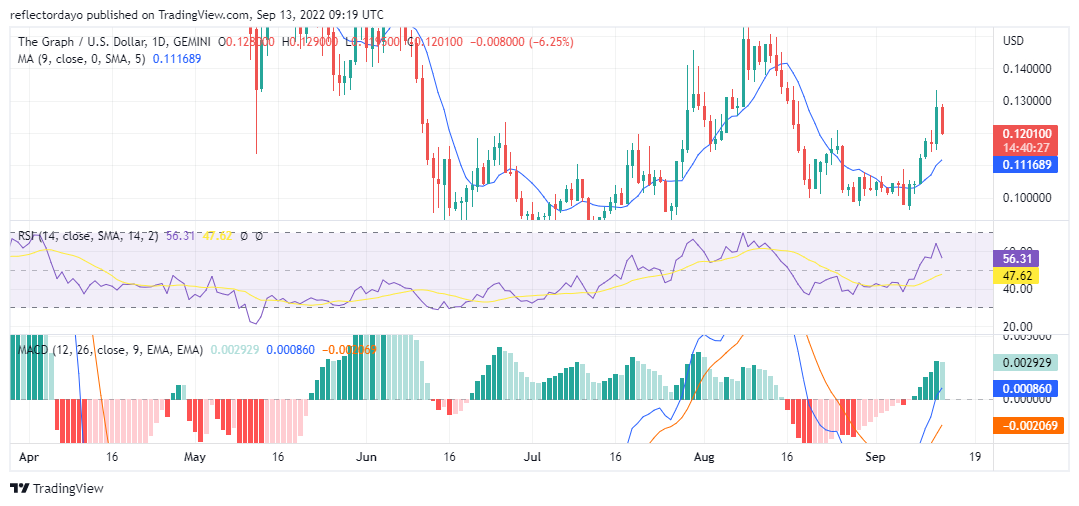
After the price of GRT/USD reached the height of $0.133281 in yesterday’s trading session, Sellers began to resist the price at that height and the price fell from there until it reaches today’s current price of $0.119985. Essentially, the price of the market is trying to find new support at the price level of $0.1200000. It is likely the price bounces off this level to resumes the uptrend.
The Graph Market Price Statistic:
- GRT/USD price now: $0.119985
- GRT /USD market cap: $829,818,955
- GRT /USD circulating supply: 6.9 Billion
- GRT /USD total supply: 10,000,000,000
- GRT /USD coin market ranking: #56
Key Levels
- Resistance: $0.130000, $0.135445, $0.140000
- Support: $ 0.116584, $0.1100000, $0.105452
Your capital is at risk
The Graph Market Price Analysis: The Indicators’ Point of View
Although the RSI line is retracing a lower level, the probability of bullish price continuation is still high. The line had dropped from 64% to 54%, however, the signal line is still rising to confirm the sentiment of bullish recovery. On the contrary, today’s histogram of the MACD indicator shows that the momentum is reducing. And, the MACD line is slowing down as well.
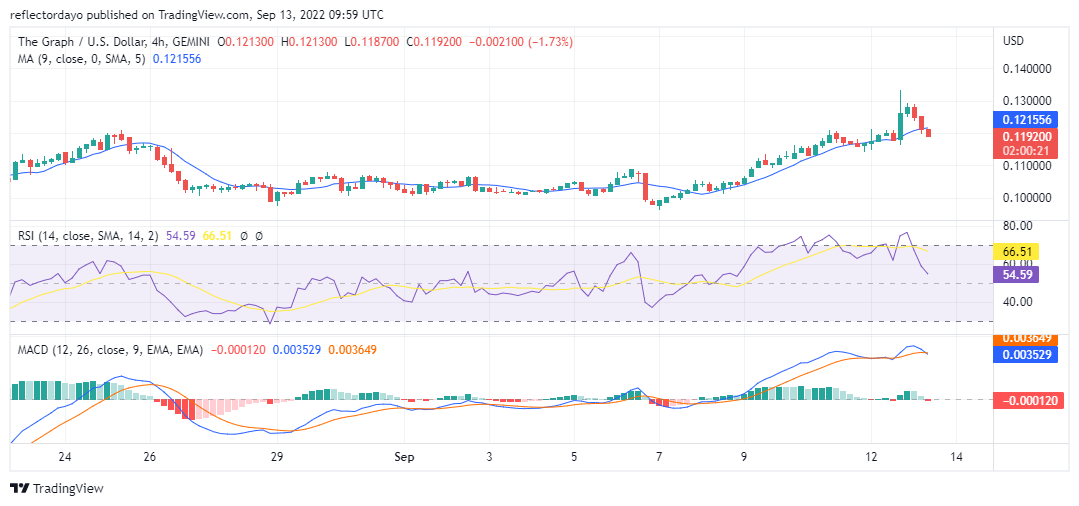
The Graph: GRT/USD 4-Hour Chart Outlook
From this point of view, the three trading sessions have been bearish. Although, the bulls attempted to come back in the second session, but they were unable to do that. And as a result of this, they lose the first three sessions to the bears. The RSI line plummeted to show how strong the momentum is in this timeframe. And in the MACD indicator the fast line had crossed the slow line. The histograms is now performing on the negative side of the indicator. Traders should wait for enough confirmations of the price directions before placing trades.
Related
Join Our Telegram channel to stay up to date on breaking news coverage