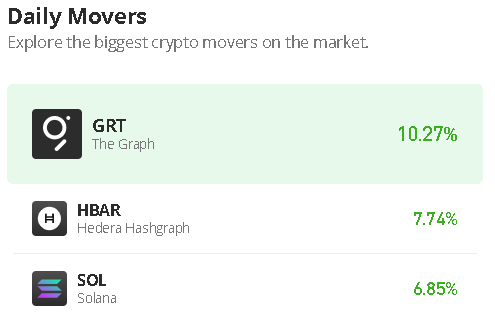
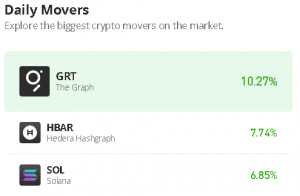
Join Our Telegram channel to stay up to date on breaking news coverage
The Graph (GRT) price prediction could set a bullish run if the market can attempt to climb back above $0.135.
The Graph Prediction Statistics Data:
- The Graph price now – $0.126
- The Graph market cap – $876.5 million
- The Graph circulating supply – 6.9 billion
- The Graph total supply – 10 billion
- The Graph Coinmarketcap ranking – #54
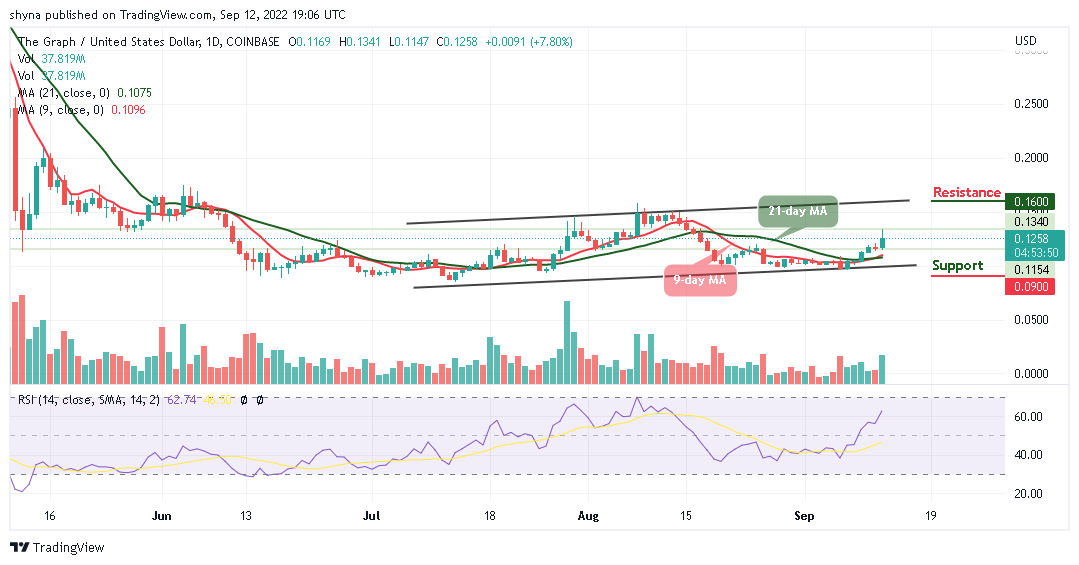
GRT/USD Market
Key Levels:
Resistance levels: $0.16, $0.18, $0.20
Support levels: $0.09, $0.07, $0.05
Your capital is at risk
At the moment, GRT/USD is at the movement running a little retracement move towards $0.13 with a price growth of 7.80%. For the fact that the Graph is recording a little gain, the Graph price may continue to maintain a bullish movement within the channel.
GRT Faces the Upside as TAMA Trades Bullishly
Looking at the daily chart, if the Graph price stays above the 9-day and 21-day moving averages, the market price may head towards the upper boundary of the channel. Any further bullish movement may push the coin above the upper boundary of the channel. Therefore, as the technical indicator Relative Strength Index (14) is crossing above the 60-level, the possible resistance levels could be found at $0.16, $0.18, and $0.20 in the long term.
However, if the coin resumes the bearish movement, traders may witness the Graph price reach lower levels. Meanwhile, GRT/USD is still moving sideways. Inversely, a bearish movement could roll the coin to the long-term support at $0.09, $0.07, and $0.05 levels.
Against Bitcoin, the Graph continues to follow the sideways movement but it is trading above the 9-day and 21-day moving averages. In case of a trend reversal, there is a need for an increasing volume and resistance to cause an upsurge in the market. At the moment, The Graph (GRT) is trading around 568 SAT. Therefore, traders can expect the nearest resistance level at 670 SAT and above.

However, if a negative movement occurs and breaks toward the lower boundary of the channel, it could hit the nearest support at 500 SAT; traders can confirm a bearish movement for the coin, and the closest support lies at 470 SAT and below. Meanwhile, the technical indicator Relative Strength Index (14) is moving to cross above the 60-level, suggesting a bullish movement.
The Tamadoge team said that the move aims to make investing in TAMA easy and safe. These users can be confident in transferring fiat into crypto, hence the need for Tamadoge to secure this deal with Transak. One of the strongest pillars of any project in the web 3.0 & crypto sector is having a solid team to see the project succeed. The TAMA website has revealed Thomas Seabrook as the Tamadoge lead developer and Carl Dawkins as the head of growth. The other members of the Tamadoge team include Neil Palethorpe and Siphamandla Mjoli, who have joined as the Senior Interaction Designer and the Senior Blockchain Developer, respectively.
Related:
Join Our Telegram channel to stay up to date on breaking news coverage