Join Our Telegram channel to stay up to date on breaking news coverage
The Graph price prediction may cause the coin to create a new upward movement as the technical indicator heads to the north.
The Graph Price Prediction Statistics Data:
- The Graph price now – $0.090
- The Graph market cap – $831.9 million
- The Graph circulating supply – 9.2 billion
- The Graph total supply – 10.7. billion
- The Graph Coinmarketcap ranking – #44
GRT/USD Market
Key Levels:
Resistance levels: $0.105, $0.110, $0.115
Support levels: $0.075, $0.070, $0.065

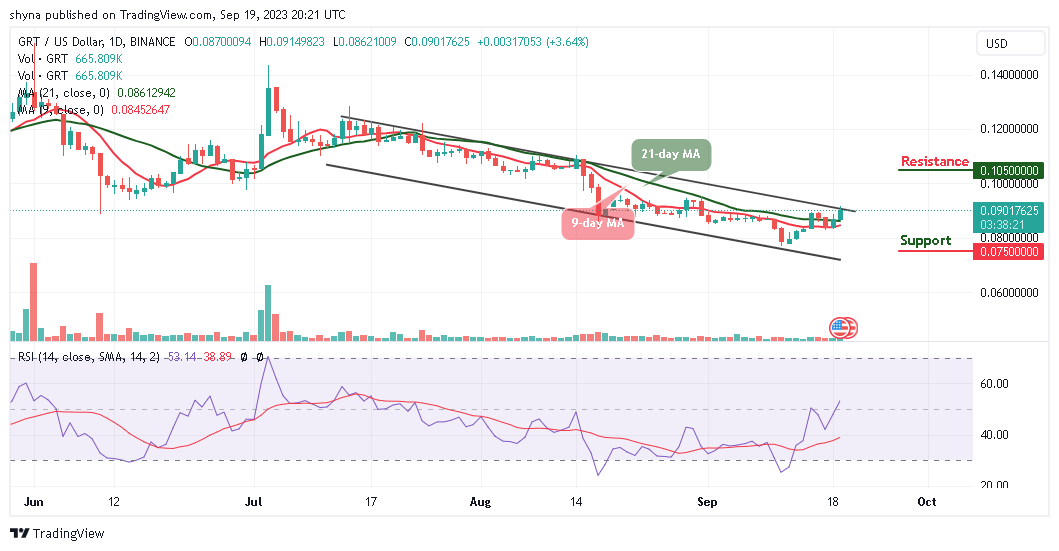
The GRT/USD pair is currently in a recovery phase, trading above the $0.087 mark, and there is a likelihood of it surging beyond the upper boundary of its trading channel shortly. Notably, The Graph’s price is presently positioned above both the 9-day and 21-day moving averages, indicating strong bullish momentum in the market.
The Graph Price Prediction: A Potential Reach of $0.100 Could Play Out
Analyzing the daily chart, it appears that the Graph price may continue its upward trajectory, potentially targeting the resistance level at $0.095 if it crosses above the upper boundary of the channel. Moreover, this bullish momentum may persist as long as the bulls manage to keep the price above the moving averages.
However, should there be a significant surge above the channel; it’s conceivable that resistance levels at $0.105, $0.110, and $0.115 may come into play. On the contrary, a decline toward the lower boundary of the channel could expose critical support levels at $0.075, $0.070, and $0.065 respectively. Meanwhile, traders are to keep an eye on the Relative Strength Index (RSI) with a period of 14, as it may move above the 60-level, providing additional insight into the market’s strength.
GRT/BTC Heading North
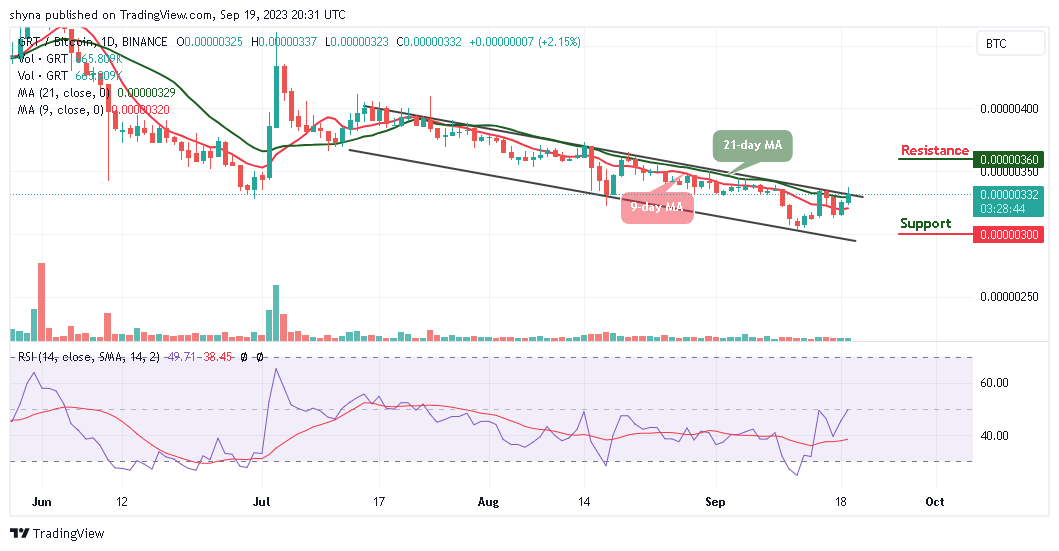
In the context of Bitcoin trading, the Graph price is displaying a bullish sentiment as it has breached both the 9-day and 21-day moving averages. The bulls seem poised for further gains, although it’s essential to monitor the potential impact if the coin were to dip below the moving averages.

At present, the Relative Strength Index (RSI) with a period of 14 is likely to make its way above the 50-level. However, if the bears manage to bring the market price below the lower boundary of the channel, GRT/BTC could find support around the 300 SAT level and potentially lower. Meanwhile, a bullish cross above the upper boundary of the channel could lead to a price surge, aiming for resistance around the 360 SAT level and above.
The Graph Alternatives
According to the daily chart, the Graph price is showing a positive movement as the coin faces the upside. The market is running a little retracement move toward $0.100 with price growth of 3.95%. Aside from today’s little gain, the Graph price is still maintaining a bullish movement and traders can expect the coin to stay above moving averages for it to gain additional gains.
In light of the ongoing developments, and as other notable tokens take a downturn, the Wall Street Memes token proudly retains its “buy” recommendation, thanks to its remarkably budget-friendly presale cost, which has already resulted in over $25 million in profits. Seize the opportunity to acquire these tokens at their current price before they embark on a significant upswing.
THIS CAN BE YOUR LAST OPPORTUNITY. $WSM PRESALE ABOUT TO BE CONCLUDED!
New OKX Listing - Wall Street Memes
- Established Community of Stocks & Crypto Traders
- Featured on Cointelegraph, CoinMarketCap, Yahoo Finance
- Rated Best Crypto to Buy Now In Meme Coin Sector
- Team Behind OpenSea NFT Collection - Wall St Bulls
- Tweets Replied to by Elon Musk
Join Our Telegram channel to stay up to date on breaking news coverage


