Join Our Telegram channel to stay up to date on breaking news coverage
The Graph price prediction shows that GRT moves to the upside as any close above the $0.130 price mark is expected.
The Graph Prediction Statistics Data:
- The Graph price now – $0.126
- The Graph market cap – $1.1 trillion
- The Graph circulating supply – 8.9 trillion
- The Graph total supply – 10.6 trillion
- The Graph Coinmarketcap ranking – #41
GRT/USD Market
Key Levels:
Resistance levels: $0.160, $0.170, $0.180
Support levels: $0.090, $0.080, $0.070
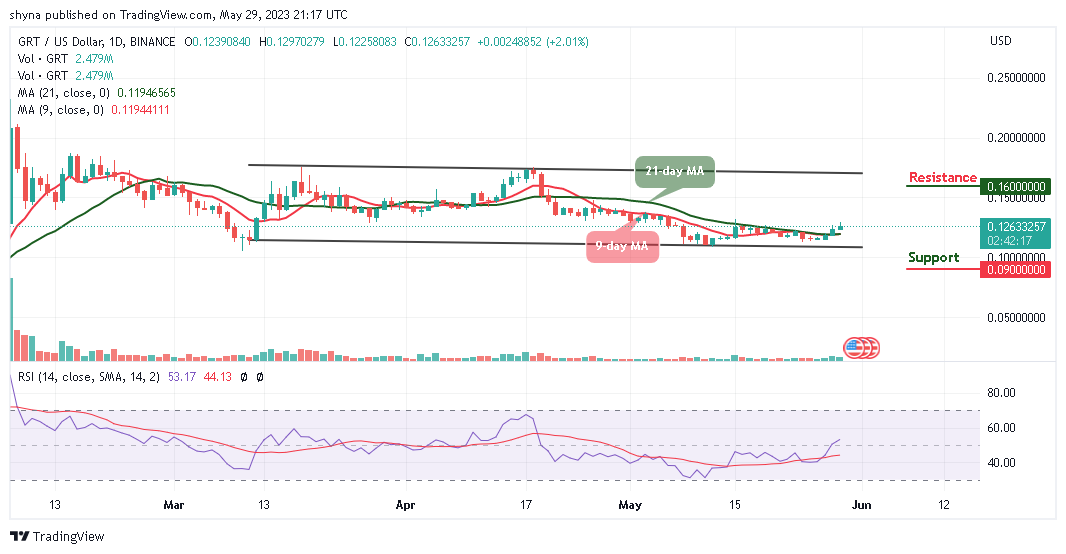
GRT/USD is seen trading at $0.126 after recording an intraday high at $0.129 during the European session today. Looking at the daily chart, The Graph (GRT) is heading toward the upside as the coin trades bullishly. GRT/USD is trading above the 9-day and 21-day moving averages after the beginning of today’s trade at $0.123.
The Graph Price Prediction: GRT May Price Spike to the Upside
Since the beginning of this month, the Graph price has been ranging within the channel, currently trading at the $0.126 level. In the meantime, The Graph price may continue to move toward the upper boundary of the channel to touch the nearest resistance at $0.130.
Nevertheless, The Graph price may begin to do well and the price could hit the resistance levels at $0.160, $0.170, and $0.180 respectively. Meanwhile, should the technical indicator decide to make a quick turn to the south, there may be a cross below the lower boundary of the channel and the bearish drop may likely roll the market down to the support levels of $0.080, $0.070, and $0.060 but the Relative Strength Index (14) is crossing above the 50-level, suggesting bullish movement.
Against Bitcoin, the Graph price is currently hovering above the 9-day and 21-day moving averages. The market price may focus on the upward movement if touches the resistance level of 500 SAT. Meanwhile, GRT/BTC is currently trading at 450 SAT as the next key resistance may come to be at 570 SAT and above.
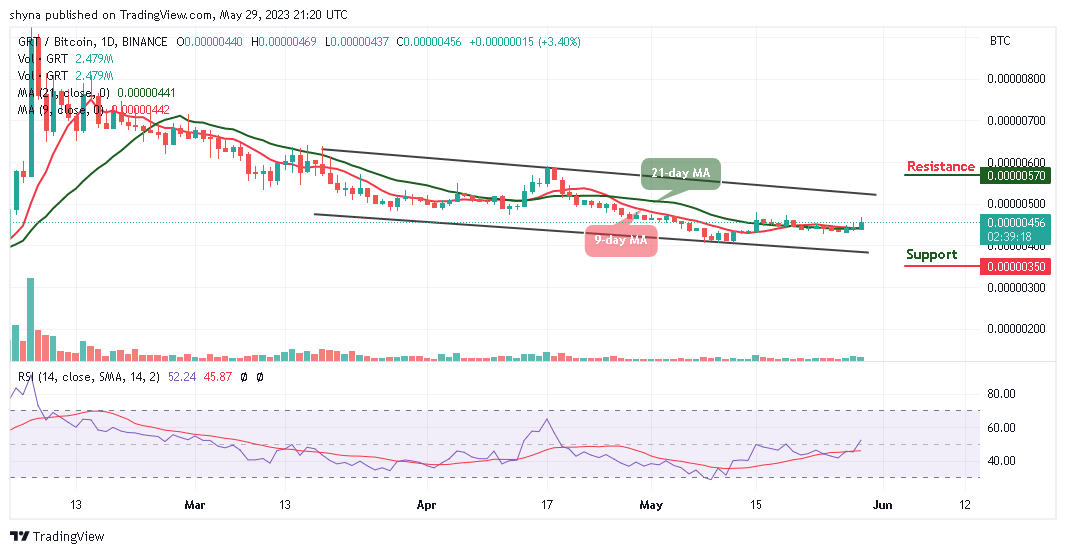
On the downside, a possible bearish movement below the 9-day and 21-day moving averages come into play, when this is done, the support level of 350 SAT and below could be visited. Meanwhile, the market may continue to have a bullish day because the Relative Strength Index (14) indicator remains above the 50-level, suggesting more bullish signals.
Alternatives to The Graph
The Graph price is on its way above the 9-day and 21-day moving averages at around $0.126. Meanwhile, if the price continues to create a bullish movement, traders can then expect a bullish continuation toward the upside. However, as the technical indicator, Relative Strength Index (14) crosses above the 50-level, the Graph price is likely to cross above the upper boundary of the channel. On that note, the Wall Street Memes token is a fully community-driven project. It highlights its commitment to user adoption through its community-first tokenomics. The entire WSM token supply is available for investors, with no separate allocation to teams or private sales.
New OKX Listing - Wall Street Memes

- Established Community of Stocks & Crypto Traders
- Featured on Cointelegraph, CoinMarketCap, Yahoo Finance
- Rated Best Crypto to Buy Now In Meme Coin Sector
- Team Behind OpenSea NFT Collection - Wall St Bulls
- Tweets Replied to by Elon Musk
Join Our Telegram channel to stay up to date on breaking news coverage