
Join Our Telegram channel to stay up to date on breaking news coverage
The Graph price prediction shows that GRT is beginning to restart the uptrend after touching the daily low of $0.11.
The Graph Prediction Statistics Data:
- The Graph price now – $0.11
- The Graph market cap – $1 billion
- The Graph circulating supply – 8.9 billion
- The Graph total supply – 10.6 billion
- The Graph Coinmarketcap ranking – #43
GRT/USD Market
Key levels:
Resistance Levels: $0.17, $0.19, $0.21
Support Levels: $0.06, $0.04, $0.02
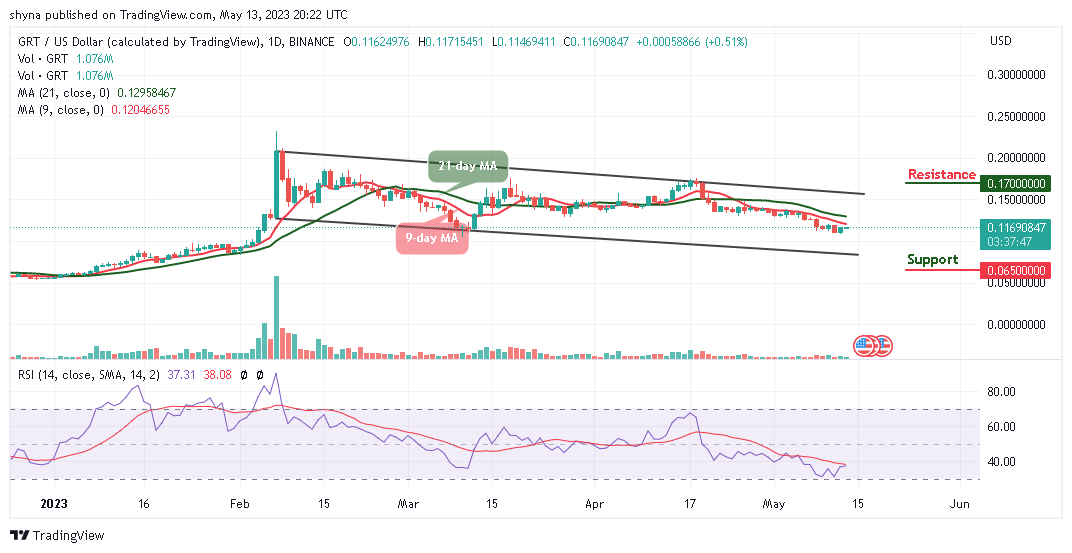
GRT/USD looks green today as the coin moves to cross above the 9-day and 21-day moving averages. However, a bullish movement toward the upper boundary of the channel may increase the Graph price to $0.15. However, traders should note that a consistent price increase could bring more buyers into the market if the bulls increase their positions.
The Graph Price Prediction: Price May Begin to Break Higher
In the past few days, the Graph price has been following the downward movement, but the bulls resumed the market and begin to push the coin toward the resistance level of $0.12. Moreover, the daily chart reveals that if the 9-day moving average crosses above the 21-day moving average, it could push the coin to the upside.
Meanwhile, bears may take advantage of the coin slide and face the lower boundary of the channel. However, the technical indicator Relative Strength Index (14) is likely to cross above the 40-level. But, if the Graph price crosses above the moving averages, it could spike toward the upper boundary of the channel, crossing above this barrier could hit the resistance levels of $0.17, $0.19, and $0.21, but crossing below the lower boundary of the channel may bring the price down to the supports at $0.06, $0.04, and $0.02.
Against Bitcoin, the Graph price is likely to cross above the 9-day and 21-day moving averages. However, intraday trading is bullish as the coin moves to cross above the upper boundary of the channel to reach the resistance level at 600 SAT and above.
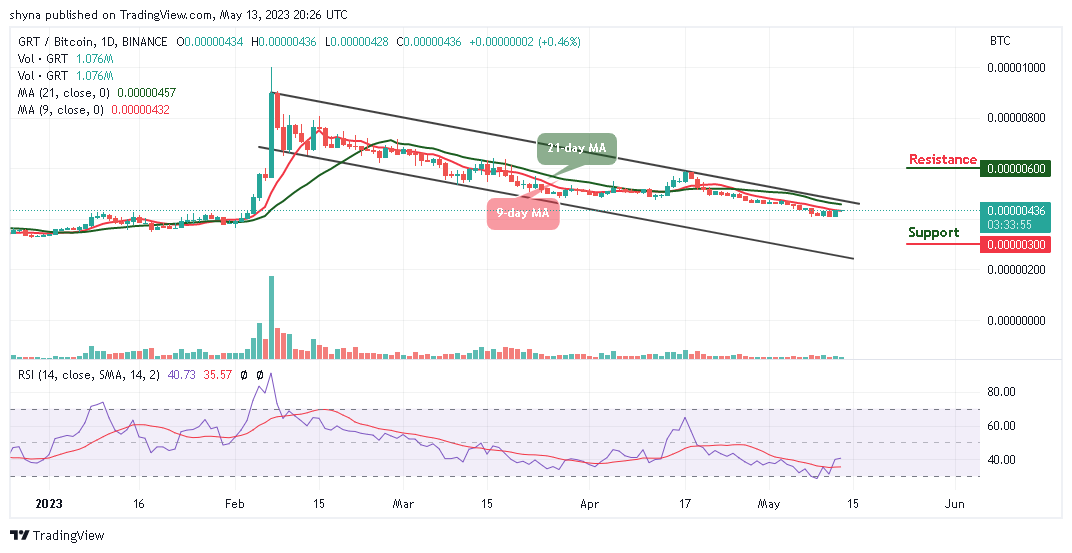
On the contrary, if the sellers bring the market down below the moving averages, any bearish movement to the downside may cause this coin to hit the support at 300 SAT and below. Meanwhile, the technical indicator Relative Strength Index (14) is above the 40-level, suggesting a bullish signal.
The Graph Alternatives
If the Graph price begins to follow the upward movement, traders can expect a bullish cross above the moving averages. Aside from today’s little gain, the Graph price is still maintaining a bullish movement and traders can expect the coin to cross above the channel for it to create additional gains. AiDoge memes, on the other hand, are backed by blockchain technology. In turn, each meme is backed by a unique NFT. This proves beyond doubt that the user owns the meme as it has raised close to $8 million in the presale. Therefore, investors are expected to move quickly before it expires.
Join Our Telegram channel to stay up to date on breaking news coverage