Join Our Telegram channel to stay up to date on breaking news coverage
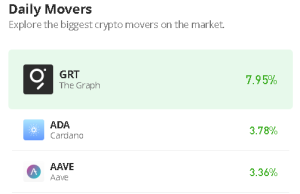
The Graph price prediction sees a 4.64% price increase over the past 24 hours of trading as the cryptocurrency touches $0.071.
The Graph Price Statistics Data:
- The Graph price now – $0.067
- The Graph market cap – is $584.7 million
- The Graph circulating supply – 8.72 billion
- The Graph total supply – 10.5 billion
- The Graph Coinmarketcap ranking – #62
GRT/USD Market
Key Levels:
Resistance levels: $0.090, $0.100, $0.110
Support levels: $0.050, $0.040, $0.030
GRT/USD gains a 4.64% price rise over the past 24 hours of trading as the cryptocurrency bounces from the $0.063 to $0.071 resistance level. The Graph price may face the upside as the red line of the 9-day MA crosses above the green line of the 21-day MA. At the time of writing, the movement is shifting back into the bullish favor, with the technical indicator Relative Strength Index (14) moving towards the upper boundary of the channel.
The Graph Price Prediction: The Graph (GRT) is Ready for a Spike above $0.070 Level
The Graph price may need to rise above $0.071 if the buyers keep the price above the 9-day and 21-day moving averages. But on the contrary, traders may consider the market as bearish if the sellers take the market movement to the lower side.
However, a bullish movement towards the upside could meet the first level of resistance at $0.080, while the potential resistance levels lie at $090, $0.100, and $0.110. Moreover, if the sellers push the price towards the lower boundary of the channel, traders may expect supports to be located at $0.050, 0.040, and $0.030, while the technical indicator Relative Strength Index (14) faces the north to give more bullish signals.
Against Bitcoin, the Graph is trading above the 9-day and 21-day moving averages and it is likely to cross above the upper boundary of the channel. From the above, the nearest resistance level is likely to touch 400 SAT. Above this, higher resistance lies at 450 SAT and above.
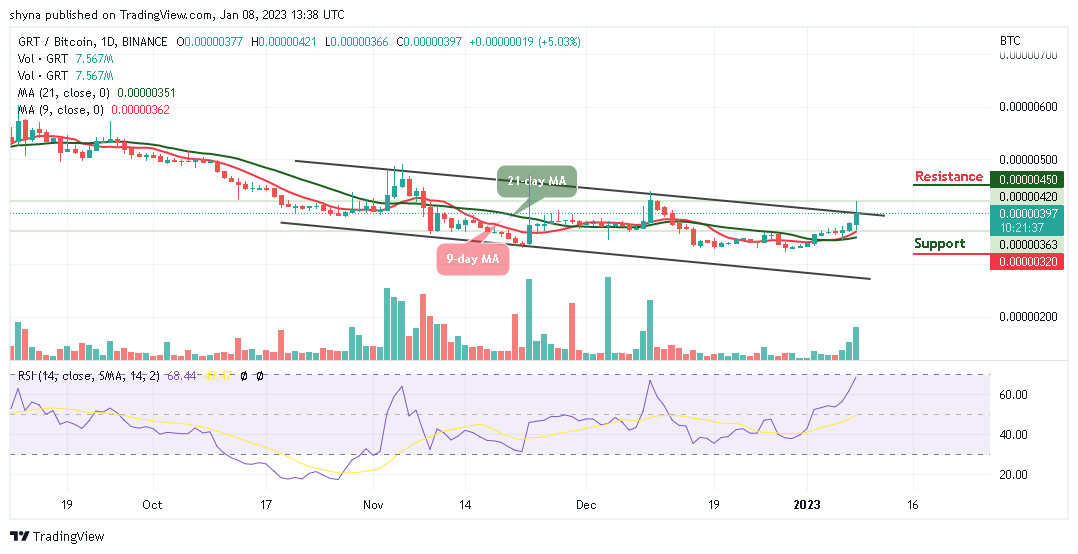
On the other hand, if the selling pressure creates a fresh low, lower support may be found at 320 SAT and below. Meanwhile, the technical indicator Relative Strength Index (14) moves to cross into the overbought region, which shows that the market may follow the uptrend.
On that note, Dash 2 Trade gives you the ability to optimize your trading and speculative profitability with effective crypto trading recommendations, auto trading, and analytics features. There is a D2T token presale ongoing and time is running out. Almost $15 million has been raised so far. You can check the platform beta version here.
Related
Join Our Telegram channel to stay up to date on breaking news coverage