
Join Our Telegram channel to stay up to date on breaking news coverage
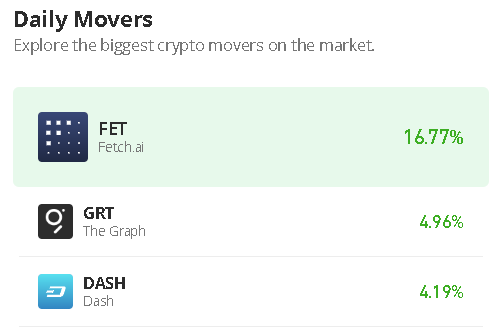
The Graph price prediction reveals that GRT could form higher as the coin trades above the 9-day and 21-day moving averages.
The Graph Statistics Data:
- The Graph price now – $0.066
- The Graph market cap – is $458.4 million
- The Graph circulating supply – 7 billion
- The Graph total supply – 10 billion
- The Graph Coinmarketcap ranking – #73
GRT/USD Market
Key Levels:
Resistance levels: $0.100, $0.110, $0.120
Support levels: $0.040, $0.030, $0.020
The Graph price is facing the upper boundary of the channel after the coin touches the resistance level of $0.068 during the European session today. Since a few days ago, GRT/USD has been trading within the 9-day and 21-day moving averages, and this refrains the coin from going back to the support level of $0.055.
The Graph Price Prediction: Will The Graph Gain Higher?
The Graph price is ready to create more additional bullish movement if it continues to rise and could probably cross above the upper boundary of the channel for it to touch the resistance level of $0.070. However, any further bullish movement above this barrier could push the market price to the potential resistance levels of $0.100, $0.110, and $0.120.
Nevertheless, this bullish movement may be invalidated if the bears break below the moving averages and head toward the lower boundary of the channel, any additional bearish movement may reach the support levels of $0.040, $0.030, and $0.020. Moreover, the technical indicator Relative Strength Index (14) is moving above the 50-level to give to keep the coin in the next positive direction.
Against Bitcoin, the Graph price is hovering above the 9-day and 21-day moving averages with a major resistance level of 400 SAT. However, the long-term moving averages may keep the bullish movement as the market is preparing to start a new trend, heading toward the upper boundary of the channel.
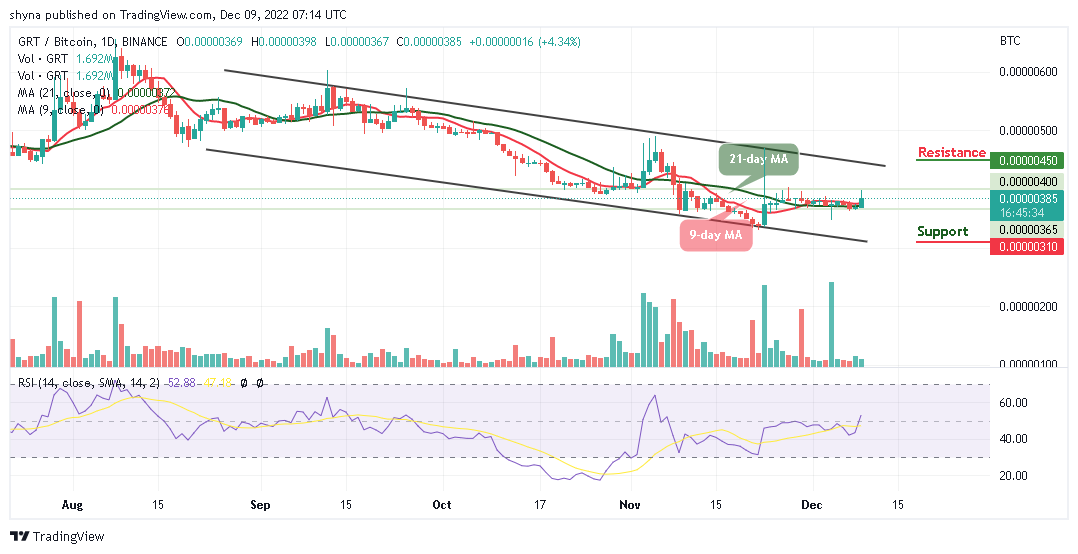
Meanwhile, if the buyers push the price towards the upper boundary of the channel, the potential resistance could be found at 450 SAT and above as the technical indicator Relative Strength Index (14) crosses above the 50-level, indicating that more buyers are likely to play out. On the contrary, if the bulls fail to move the coin to the upside, the bears may step back into the market, and the nearest support level could be located at 310 SAT and below.
Nevertheless, many that invest in Impact Token (IMPT) will be able to claim them from December 12, 2022. In order to do this, they will connect the wallets they used to buy the tokens initially, and the token will be dropped into their wallets. Also Uniswap, LBank, and Changelly Pro will list IMPT for trading, once the presale has been concluded. This environmentally friendly project is gaining traction and close to $17 million has been raised in the current IMPT presale.
However, Dash 2 Trade aims to guide all trades to speculate more proficiently. This is because effective risk control parameters are necessary for building robust strategies for initiating winning trades. There is a D2T presale ongoing and time is running out. The presale dashboard launch is coming soon since the product dev is ahead of the schedule. So far, the presale has raised almost $9.5 million.
Related
Join Our Telegram channel to stay up to date on breaking news coverage