Join Our Telegram channel to stay up to date on breaking news coverage
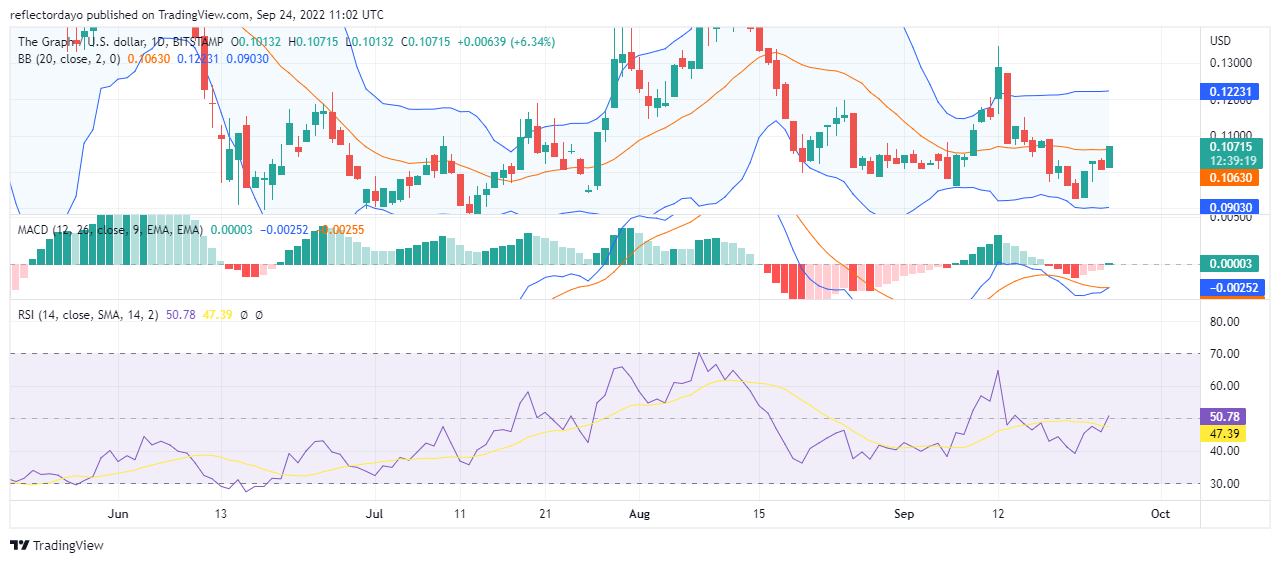
The Graph started to trend down on the 13th of September with very strong selling pressure. And this trend continued until the 20th of September when a bullish engulfing pattern candlestick formed on the chart. The Bullish engulfing pattern signals beforehand that the down-trending market is about to switch to an up-trending one. Today’s bullish market furthermore confirms the bullish trend that started on the 20th of September. Today and yesterday candlesticks also are an engulfing candlestick pattern.
The Graph Market Price Statistic:
- GRT/USD price now: $0.1067
- GRT /USD market cap: $ 736,497,106
- GRT /USD circulating supply: 10,057,044,431
- GRT /USD total supply:10,000,000,000
- GRT /USD coin market ranking: #58
Key Levels
- Resistance: $0.11004, $0.12000, $0.13000
- Support: $0.10000, $0.09000, $0.08500
Your capital is at risk
The Graph Market Price Analysis: The Indicators’ Point of View
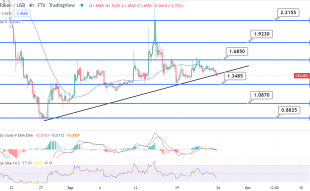
From the RSI and the MACD of The Graph, The market is recovering from the bearish position and now, it is entering into a bullish market trend. In confirmation of this Bullish engulfing candlestick pattern that occurred two times on the chart. The negative histogram of the MACD is losing strength and gradually giving way to the bullish trend. In addition to that, in the negative zone of the MACD indicator, the MACD line is almost crossing the signal line. When the line crosses each other in the negative zone, the market will pass the first test of a bullish market. We will be sure that the trend will continue if the fast line crosses each other in the negative zone of the indicator and they continue upward. The RSI line is at the midpoint of the indicator; this also tells us that The Graph is just about stepping out of the weak market zone
The Graph: GRT/USD 4-Hour Chart Outlook
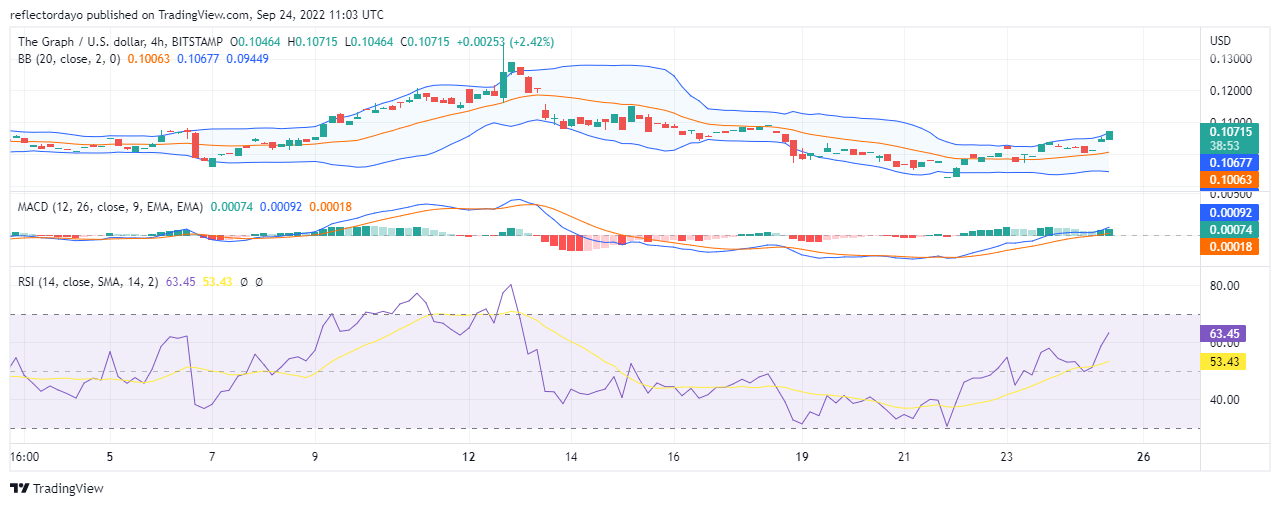
The market today started with a four-price doji candlestick. The nature of this type of candlestick is a flat body with no upper shadow or lower shadow. The significance of this candle is that the market, for that particular session, opened and closed at the same price. Also the high and low are just the same value. This is a high level of indecision in the market. However, the market begins to move to the upside in the second session and the third session. At this height, traders begin to take profits and the GRT/USD market had a price retracement to a lower level. For now, we noticed that the downward price movement is slowing down. The market may resume its upward direction.
Join Our Telegram channel to stay up to date on breaking news coverage
