Join Our Telegram channel to stay up to date on breaking news coverage
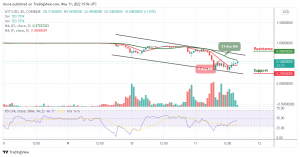
After a successful break above $0.50, the TerraUSD price prediction extended its recovery to touch the resistance level of $0.54.
UST/USD Long-term Trend: Bearish (45 Minute Chart)
Key levels:
Resistance Levels: $0.80, $0.90, $1.00
Support Levels: $0.25, $0.15, $0.05
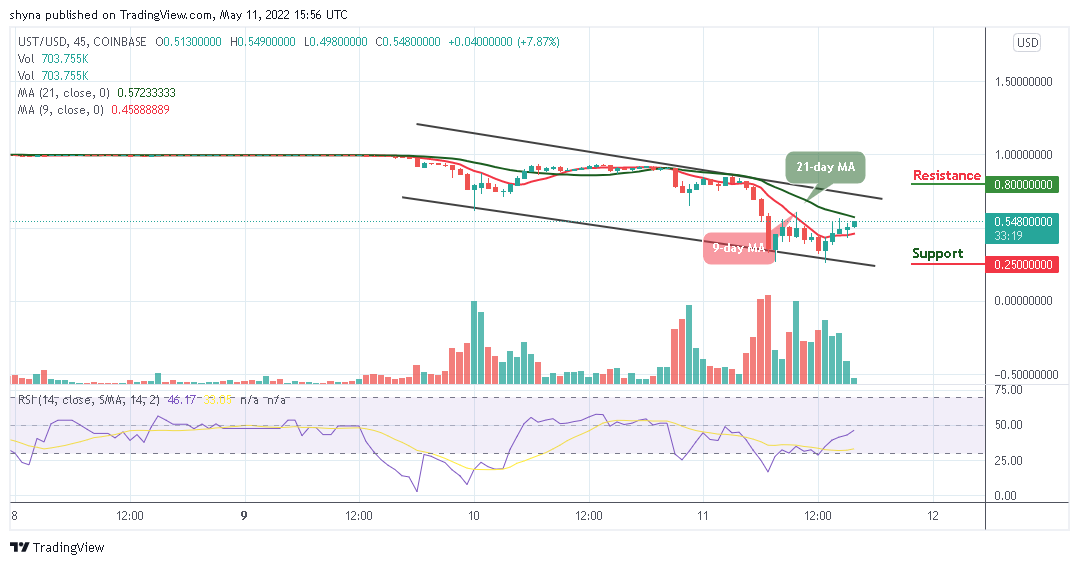
UST/USD faces some sharp declines in the crypto market as the price touched $0.49 support. The TerraUSD price is also hovering within the 9-day and 21-day moving averages and the movement is very fragile at the moment. During a short-term breakout, critical support levels may need to be monitored as the crypto could cross above the 21-day MA to head towards the upper boundary of the channel.
TerraUSD Price Prediction: Is TerraUSD Bull Run Still Intact?
Looking at the 45-minute chart, the TerraUSD price increases more than 7.87% as the coin move to touch the resistance level of $0.54. More so, the cryptocurrency touches the low of $0.49 before recovering towards the upper boundary of the channel. Therefore, a sustained movement to the upside could hit the resistance levels of $0.80, $0.90, and $1.00.
On the contrary, there could be more losses if there is no break above the $0.70 resistance. Therefore, if there is a downside break below the lower boundary of the channel, the TerraUSD price may accelerate its decline towards the support levels of $0.25, $0.15, and $0.05 while the Relative Strength Index (14) moves to cross above 50-level.
UST/USD Medium-Term Trend: Bearish (15 Minute Chart)
Looking at the chart, UST/USD should recover above $0.60 to mitigate the short-term bearish pressure and allow for an extended recovery towards $0.90 and above. However, a sustainable move below the 9-day and 21-day moving averages may open up the way toward $0.40.
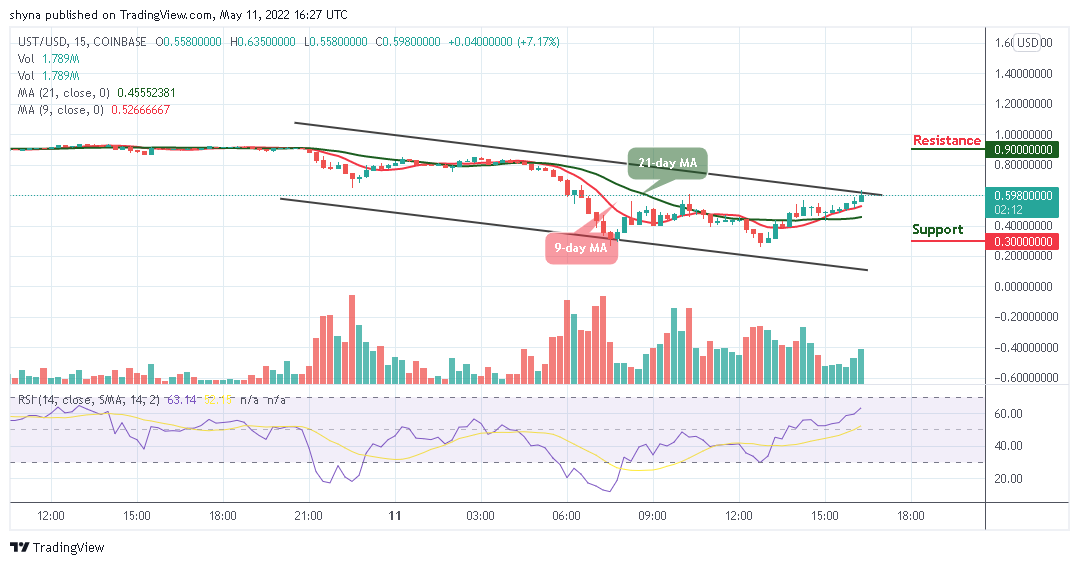
However, the critical support is located at $45,000, and a sustainable move lower could increase the downside pressure and push the price towards the support of $0.30 and below. Considering that the Relative Strength Index (14) signal line is crossing above 60-level, traders might expect more bullish signals to play out.
Read more:
Join Our Telegram channel to stay up to date on breaking news coverage